Short Term Indicator
The Short-term Indicator gauge is updated every Monday morning and reflects our reading of the stock market at that point in time. Read More...
The Short-term Indicator gauge is updated every Monday morning and reflects our reading of the stock market at that point in time. This indicator is based on our technical interpretation of stock market data including price action, volume, market breadth, etc., and not based upon economic data or stock market valuation.
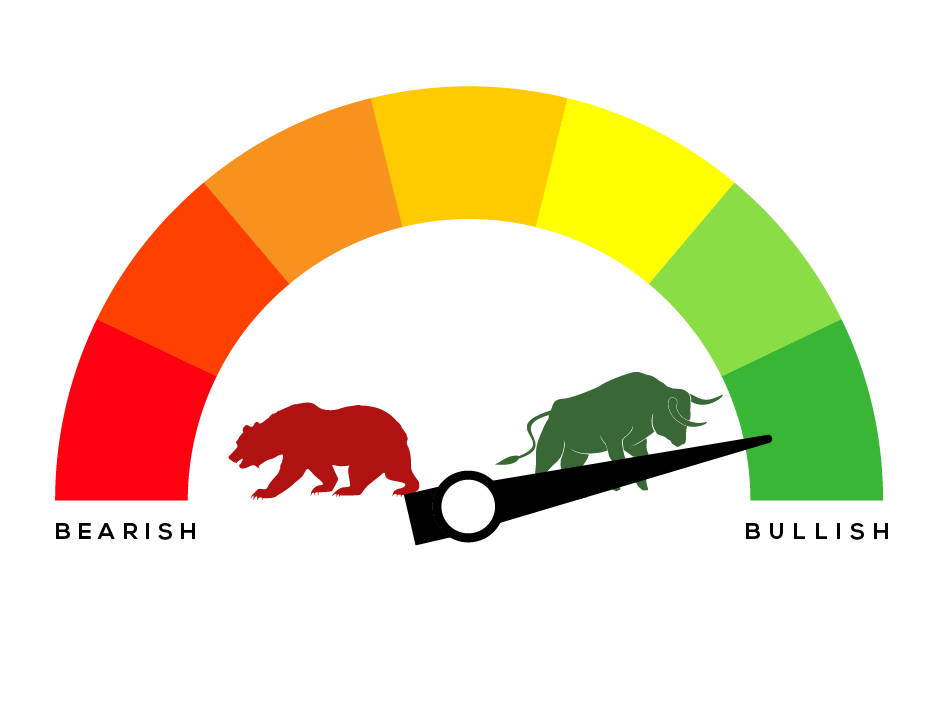
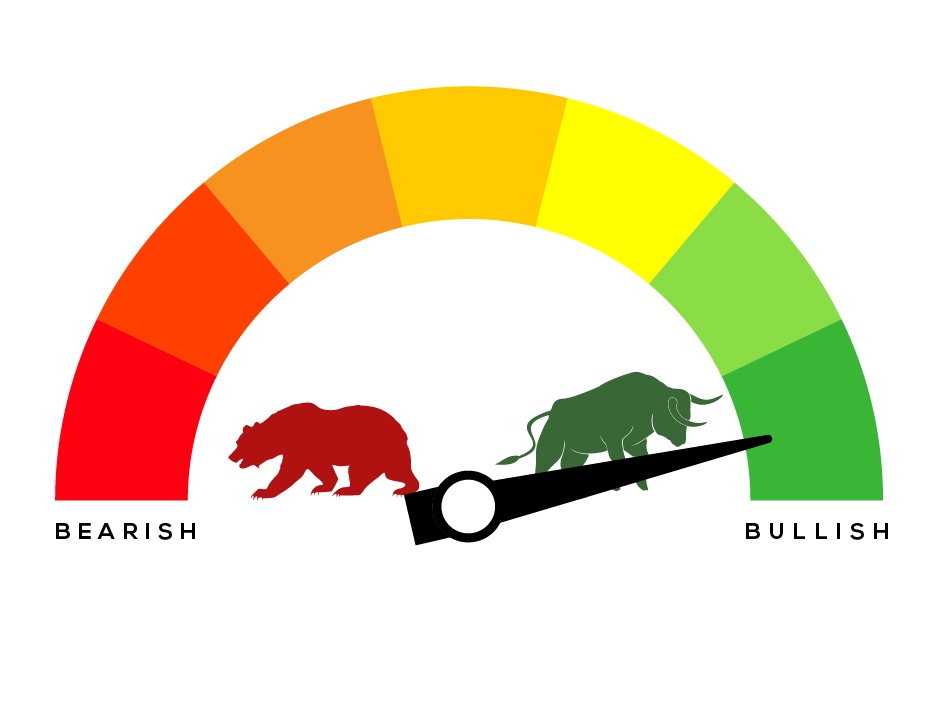
Since the stock market has a strong upward bias, our short-term indicator gauge will normally be pointed to the right in the most “bullish” position.
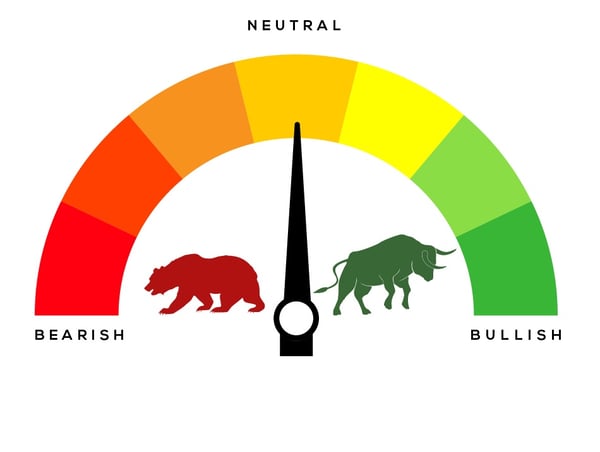
 When the stock market shows signs of technical weakness, we will reduce risk (i.e., market exposure) in our active risk managed stock strategies and move our short-term indicator gauge counter clockwise towards “neutral” or “bearish.”
![]()
 When pointed all the way to the left in the most “bearish” position, we consider the stock market to be in a short-term correction, which could last anywhere from several days to several weeks.
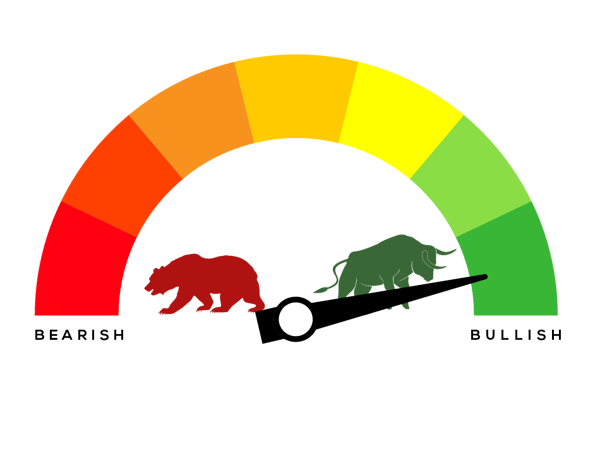
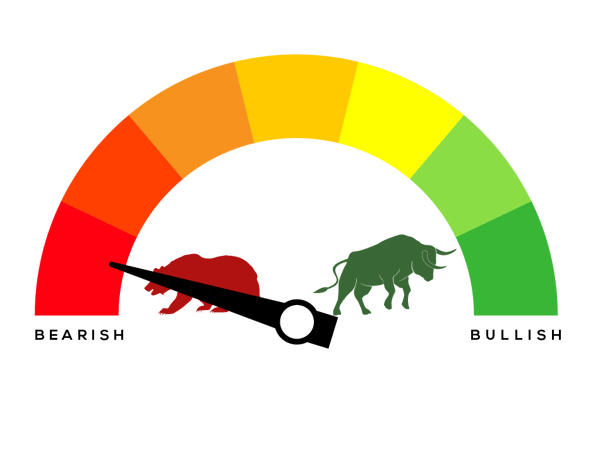 When the stock market becomes oversold and/or begins to show signs of strengthening, we will increase stock exposure and adjust the short-term indicator gauge clockwise accordingly in the bullish direction.
Note: The short-term indicator gauge is based upon past market behavior and should not be considered “predictive” of market direction. It is not intended to be advice for either buying or selling stocks.