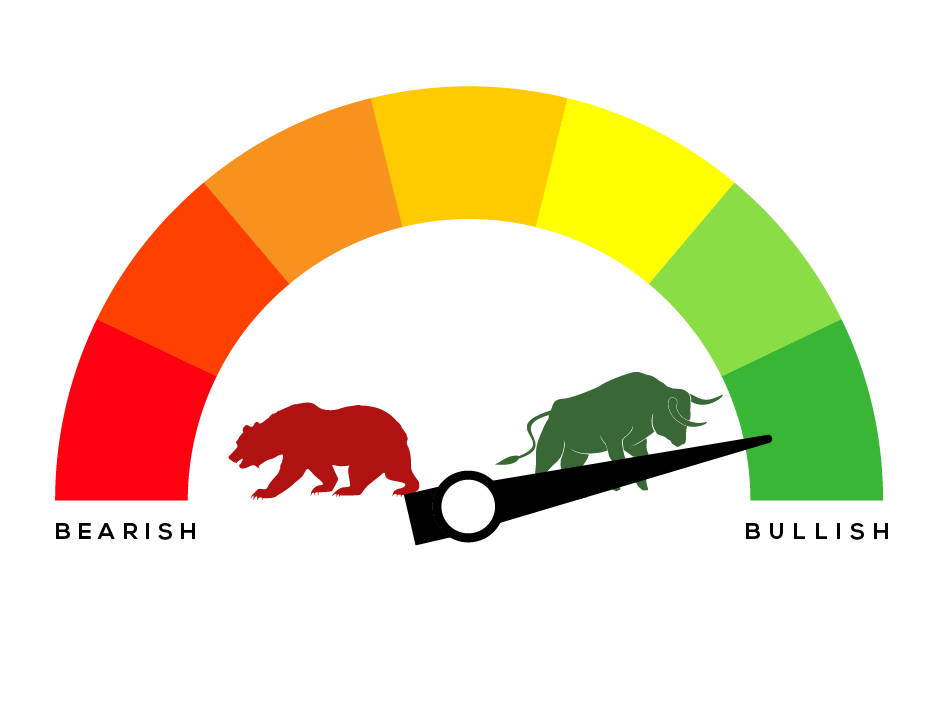
Stocks finished the week roughly flat as second quarter earnings reports continued to come in amid a backdrop of global trade headlines.
U.S. Markets: Stocks finished the week roughly flat as second quarter earnings reports continued to come in amid a backdrop of global trade headlines. The Dow Jones Industrial Average rose 39 points to close at 25,058, a gain of 0.15%. The technology-heavy NASDAQ Composite gave up just 6 points to end the week at 7,820. Small caps were the best performers of the week with the Russell 2000 index adding 0.6%, while the large cap S&P 500 and mid cap S&P 400 rose just 0.02% and 0.1% respectively.
International Markets: Canada’s TSX retraced most of last week’s gain by falling -0.76%. Europe’s markets were mixed. The United Kingdom’s FTSE rose for a second week, finishing up 0.2%, France’s CAC 40 fell -0.6%, Italy’s Milan FTSE retreated ‑0.5%, and Germany’s DAX added 0.2%. In Asia, China’s Shanghai Composite retreated a slight -0.1%, while Japan’s Nikkei had a second week of gains by finishing up 0.4%. As grouped by Morgan Stanley Capital International, developed markets added 0.4% last week, while emerging markets rose 0.3%.
Commodities: Commodities have had a tough go of late. Gold continued to sell off, losing ground in five out of the last six weeks. Gold ended the week at $1,231.10 an ounce, down -0.8%. Silver was off a steeper -1.7%, ending the week at $15.55 an ounce. Oil had its third down week, giving up -3.9% and closing at $68.26 per barrel of West Texas Intermediate crude oil. Copper, also known as “Dr. Copper” by some analysts for its alleged ability to forecast global economic health due to its variety of industrial uses, had its sixth consecutive down week, falling an additional -0.7%.
U.S. Economic News: New claims for unemployment benefits sank to a 48-year low as a record number of job openings and continued labor shortages kept layoffs in check. The Labor Department reported initial jobless claims fell last week by 8,000 to 207,000—its lowest level since the end of 1969. Economists had forecast a reading of 224,000. The less volatile monthly average of new claims slipped by 2,750 to 220,500. Continuing claims, the number of people already receiving unemployment benefits, remained near a multi-decade low rising by just 8,000 to 1.75 million. Some analysts are beginning to express their belief that the country has reached “peak employment”. Thomas Simons, senior economist at Jeffries LLC noted, “Given the size of the labor force and the typical pace of employment churning, it is hard to imagine that claims could go much lower.”
The number of new homes under construction fell to a 9-month low as builders broke ground on fewer homes in June. Housing starts fell to a seasonally-adjusted annual rate of 1.173 million in June, according to the Commerce Department. The reading fell short of expectations of 1.303 million. The reading characterized the volatile stop-start rhythm that has characterized the uneven housing recovery. June’s pace of starts was 12.3% lower than May’s downwardly-revised reading and 3% lower than the same time last year. Analysts caution that the government’s data on residential construction is based on small sample sizes and is often heavily revised. Year-to-date, starts are 7.8% higher than the same period last year, while permits are 5.7% higher. In general, analysts aren’t concerned about housing just yet. Stephen Stanley, chief economist for Amherst Pierpont Securities stated in a note, “If starts fail to rebound in July, I will begin to worry, but for now, I would tend to view the June downside surprise as more noise than signal.”
Confidence among the nation’s home builders remained high as continued buyer demand offset concerns over a global trade war. That National Association of Home Builders (NAHB) reported its builder sentiment index remained unchanged at 74, matching economists’ forecasts. The number remained at a level the industry group called “healthy”. In the details, the index’s components were mixed. The gauge of views on the current state of sales remained unchanged at 74, but views of future sales fell 2 points to 73. The sub-index that tracks buyer traffic rose two points to 52—its highest reading since February. While all the economic fundamentals are in place for a strong housing market (buyer demand, a solid jobs market, and reasonable interest rates), a looming global trade war is beginning to impact home prices. The NAHB estimated new tariffs may already be adding nearly $9,000 to the average cost of each new single-family home.
U.S. retail sales rose solidly in June following a huge gain in May, underscoring the strength in the U.S. economy as spring turned to summer. The Commerce Department reported retail sales increased 0.5% in June. In addition, May’s reading was revised up to a 1.3% gain--a big improvement over the 0.8% originally reported. Retail sales have increased 6.6% over the past year, slightly above the long-term average since 1980. A wide variety of retail sectors saw an increase in sales. Health and personal care store sales jumped 2.2%, restaurants posted a 1.5% increase, and internet sales rose 1.3%. Auto dealers reported a 0.9% increase. Analysts note that the Trump tax cut, strong hiring, and falling unemployment have given Americans more confidence in the economy. That’s led to a big rebound in the spring following a winter lull.
Industrial production rose in June on a rebound in manufacturing and further increases in mining output. The Federal Reserve reported that industrial production increased 0.6% in June, more than reversing May’s -0.5% decline. In the second quarter, industrial production increased at a 6% annualized rate, faster than the 2.4% logged in the January through March first quarter period. A 7.8% surge in motor vehicle production led to an overall 0.8% bump in manufacturing output. Mining production increased 1.2% on top of the 2.2% rise in May. Mining output has now surpassed its previous all-time peak, which was set in December of 2014. With production increasing solidly last month, capacity utilization - a measure of how fully firms are using their resources - increased to 78.0% from 77.7% in May. Although high, it is 1.8 percentage points below the 1972-to-2017 average of capacity utilization.
In the Federal Reserve’s latest Beige Book, a collection of anecdotal information on current economic conditions from each of the Fed’s member banks, a shortage of qualified workers and rising costs of raw materials are beginning to show their effects. The Federal Reserve said the rapidly expanding U.S. economy is running out of room to grow. Interviewees expressed fears of increasing tariffs and a broader trade war, adding to the anxiety. However, the Beige Book was notably more optimistic than it was just a few months ago. The Federal Reserve found that 11 of its 12 regions of the country were growing at a “modest” pace or faster, while only the states around St. Louis reported “slight” growth. In summary, “Economic activity continued to expand across the United States,” the Fed said.
A widely-followed index that attempts to forecast the nation’s economic health reported a higher reading in June. The Conference Board’s Leading Economic Index (LEI) rose 0.5% in June, after a flat reading in May. The LEI’s measure of current conditions climbed 0.3%. Most of the segments of the economy covered by the leading index showed greater strength in June with the lone exception of housing. Higher interest rates, a shortage of construction workers and rising costs of supplies such as lumber were cited. The LEI is a weighted gauge of 10 indicators designed to signal business-cycle peaks and valleys. For now, the economy appears to be on solid footing. Ataman Ozyildirim, economist at the Conference Board stated, “The widespread growth in leading indicators, with the exception of housing permits which declined once again, does not suggest any considerable growth slowdown in the short-term.”
International Economic News: Inflation in Canada hit a more than six-year-high last month as higher prices for energy and an economy operating at near full potential pushed prices higher. Canada’s consumer price index (CPI) rose 2.5% on a one-year basis, according to Statistics Canada. The reading followed a 2.2% annual increase the previous month. Inflation was lifted by a nearly 25% annual increase in the price of gasoline, along with increases in air fares, restaurant meals, and mortgage-interest costs. The June advance marks the largest 12-month increase in consumer prices since February of 2012. In its latest statement, the Bank of Canada forecast Canada’s CPI to climb to 2.5% before retreating closer to 2% by the second half of next year.
The United Kingdom’s economy will suffer more than the EU in a “no deal” Brexit scenario, the International Monetary Fund (IMF) warned. Based on its newest models, the IMF suggests that the EU could take an economic hit of up to 1.5% of GDP over the long term if the UK leaves the EU with no deal. However, that pales in comparison to the 4% GDP hit the UK will take. The Washington-based organization noted other think-tanks also estimated economic damage to the UK from a no deal Brexit were also high. The IMF had previously warned in 2016 that were Britain to vote to leave the EU, British living standards would suffer, inflation would rise, and up to 5.5% of British GDP would be wiped away. Since none of that has (yet) occurred, many Britons are rolling their eyes at the latest doom-and-gloom from the IMF.
On Europe’s mainland, the United States sought to entice Europe and Japan with free trade deals to gain leverage in an escalating tariff war with China, but faced stiff resistance from France at a G20 finance ministers meeting. French Finance Minister Bruno Le Maire said the European Union would not consider launching trade talks with the United States unless Trump first withdraws the steel and aluminum tariffs and backs down from its latest car tariff threat. “We refuse to negotiate with a gun to our head,” Le Maire told reporters on the sidelines of the G20 meeting.
Germany’s Finance Ministry has released its monthly report for July, stating German economic growth likely accelerated slightly in the second quarter following the 0.3% increase in the first three months of the year. However, it warned that a global trade war and Brexit both present risks to its outlook. In its July monthly report, the ministry described the domestic economy as being in “robust” shape and delivering “considerable drive” to the upswing. It expected growth in the second quarter to be “slightly stronger” than in the first. “But risks remain, especially in the foreign trade environment,” the ministry said in the report. “Protectionist tendencies have increased and the risk of a global trade conflict has risen.”
China’s currency is has been plunging, hitting its lowest level in over a year on Friday. The yuan has now fallen by more than 8% over the past three months in the midst of trade tensions with the United States and an economic slowdown. Analysts say the yuan’s latest dip came after China’s central bank indicated it was willing to accept a weaker currency to allow China’s huge export industry to cope with new U.S. tariffs. The weaker yuan would make Chinese products cheaper for buyers who pay in U.S. dollars. Unlike the dollar or euro, the yuan does not float freely against other currencies. Instead, China's central bank — the People's Bank of China — “guides” the currency by setting a daily trading range. How much lower it will go is anyone’s guess. Qi Gao, a currency analyst at Scotia Bank, expects the currency to weaken almost another 2% against the dollar before China’s central bank would feel compelled to halt the yuan's descent.
- Please visit our website www.pacificinvestmentresearch.com for more insights. Email us at info@pacificinvestmentresearch.com if you have any questions.


