In the markets:
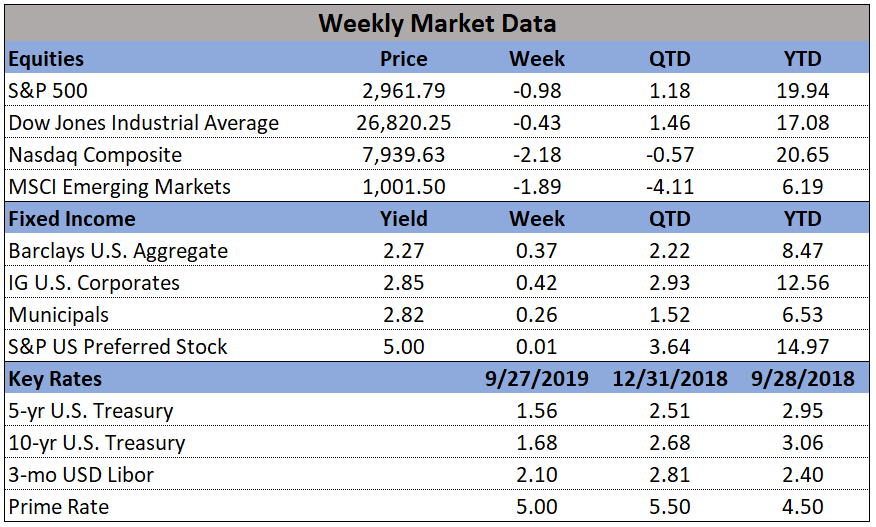
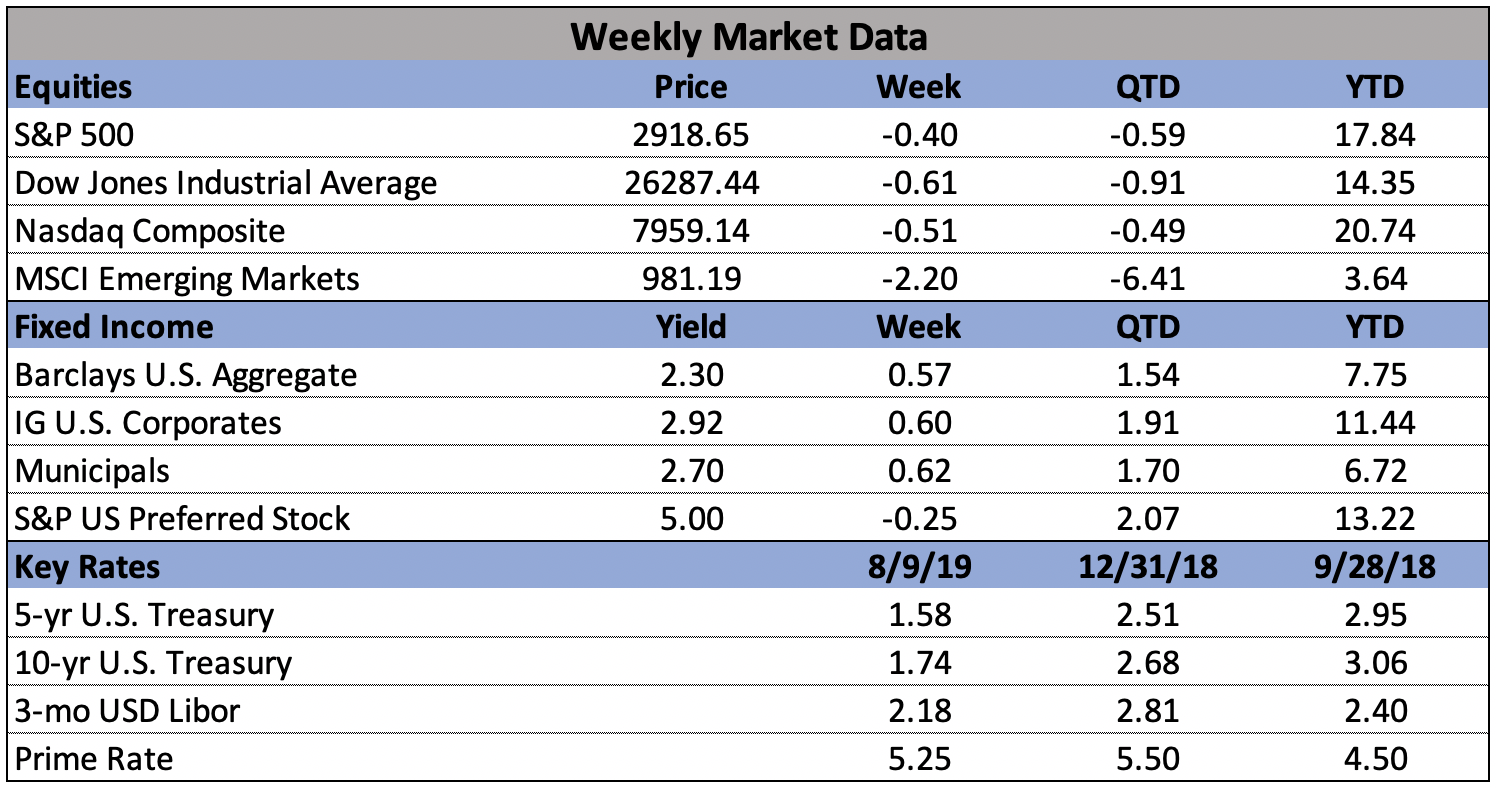
U.S. Markets: Growing trade tensions between the world’s two most important economies pushed markets lower for a second consecutive week. The major indexes suffered their worst day of the year at the beginning of the week as China let its currency fall below the key symbolic threshold of 7:1 yuan:dollar that has stood over the past decade. In addition, the Chicago Board Options Exchange Volatility Index (VIX) hit its highest level since late last year. But a big turnaround on Wednesday and Thursday of almost 1,000 Dow points from Wednesday’s lows gave some hope that the storm had calmed. The Dow Jones Industrial Average retreated 197 points, or -0.75%, to end the week at 26,287. The technology-heavy NASDAQ Composite fell -0.6% to 7,959. By market cap, large caps fared the best with the S&P 500 giving up just -0.5%, while the S&P midcap 400 and small cap Russell 2000 lost -0.7% and -1.3%, respectively.
International Markets: Canada’s TSX retraced some of last week’s decline by rising 0.4%, but other major international markets weren’t so lucky. The United Kingdom’s FTSE added to last week’s decline, falling an additional -2.1%. On Europe’s mainland, France’s CAC 40 finished down -0.6%, Germany’s DAX lost -1.5%, and Italy’s Milan FTSE gave up -3.4%. In Asia, China’s Shanghai Composite retreated -3.3%, while Japan’s Nikkei ended down -1.9%. As grouped by Morgan Stanley Capital International, developed markets finished down -1.2%, while emerging markets gave up –1.7%.
Commodities: Precious metals continued their ascent. Gold added $51, or 3.5%, to finish the week at $1508.50 an ounce, while Silver surged over 4% to $16.93 an ounce. Oil closed down for a second week, giving up -2.1% to $54.50 per barrel. The industrial metal copper, viewed by analysts as a barometer of world economic health because of its wide variety of uses, managed a 0.7% gain after two weeks of losses.
U.S. Economic News: The number of Americans seeking first-time unemployment benefits fell last week, providing further evidence that the labor market remains strong. The Labor Department reported initial jobless claims dropped by 8,000 to 209,000 last week. Economists had expected new claims would total 215,000. Analysts note that historically jobless claims are one of the first economic indicators to trigger when the economy starts to weaken. However, there’s been no sign of slippage yet even with the economy now in its eleventh year of expansion. The less volatile monthly average of new claims remained essentially flat at 212,250. The number of people already collecting unemployment benefits, known as continuing claims, declined by 15,000 to 1.68 million. Those claims remain near their lowest levels since the early 1970s.
The number of jobs available across the country fell slightly in June but remained above 7 million for the 15th straight month. The Bureau of Labor Statistics’ Job Openings and Labor Turnover Survey (“JOLTS”) reported the number of open jobs at 7.35 million in June, down slightly from 7.38 million. The record, set near the end of last year, is 7.6 million. Job openings rose in retail and real estate, while fewer jobs were available in construction, leisure, and hospitality. For the 16th consecutive month, job openings outnumbered the number of Americans unemployed. There were 1.25 million more jobs listed than the 6.1 million workers officially classified by the government as unemployed. The closely-watched “quits rate” remained unchanged at 2.5%. It’s rumored that the “quits rate” is the Federal Reserve’s “secret” indicator to gauge the health of the labor market as it is presumed an employee would only leave a job if he or she were confident of finding a more lucrative one.
The services side of the economy, which makes up about three quarters of the total, slowed last month to its lowest growth rate in almost three years. The Institute for Supply Management reported its non-manufacturing index dropped 1.4 points to 53.7—its slowest reading since August of 2016. The reading widely missed economists’ estimates for a reading of 55.5. In the details, the components that measure new orders, production, prices and backlogs all declined, while the employment gauge increased. Overall, the rate of growth in the services sector continues to weaken, though still positive (readings above 50 indicate growth). Respondents to the survey frequently cited tariffs at the top of their list of concerns. Jim O’Sullivan, chief U.S. economist at High Frequency Economics commented, “Non-manufacturing remains stronger than manufacturing, consistent with non-manufacturing being less exposed to weakening in foreign demand, but it is showing slowing nonetheless.”
Inflation at the wholesale level rose modestly last month, but remained well within the bounds watched by the Federal Reserve. Producer prices rose 0.2% in July after ticking up 0.1% in June. Over the past 12 months, the PPI increased 1.7%. Economists polled by Reuters had forecast the PPI would rise 0.2% in July and increase 1.7% on a year-on-year basis. Excluding the volatile food, energy, and trade services components, producer prices actually ticked down -0.1% last month, the first decline since October 2015. Over the past 12 months, the so-called core PPI increased 1.7%. The Fed, which has a 2% inflation target, tracks the core personal consumption expenditures (PCE) price index for monetary policy. The core PCE price index increased 1.6% on a year-on-year basis in June and has undershot its target this year. The inflationary effects of tariffs predicted by so many have yet to materialize.