In the markets:
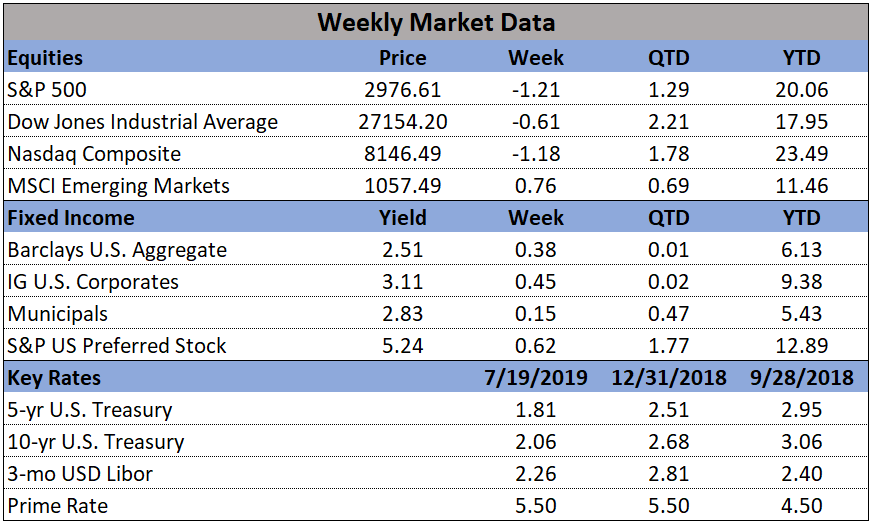
U.S. Markets: The major U.S. indexes finished the week lower as the second-quarter earnings season began in earnest. The narrowly focused Dow Jones Industrial Average managed the best return by declining just -0.7%, while the technology-heavy NASDAQ Composite finished down -1.2%. By market cap, the large cap S&P 500 and mid cap S&P 400 each retreated -1.2%, while the small cap Russell 2000 was off -1.4%.
International Markets: Canada’s TSX finished essentially flat, down just -0.01%. Across the Atlantic, the United Kingdom’s FTSE managed a slight 0.04% gain. On Europe’s mainland France’s CAC 40 was off -0.4%, Germany’s DAX retreated -0.5%, and Italy’s Milan FTSE slumped -2.4%. In Asia, China’s Shanghai Composite finished down -0.2% while Japan’s Nikkei gave up -1.0%. As grouped by Morgan Stanley Capital International, developed markets finished down -0.4%, while emerging markets gained a tiny 0.02%.
Commodities: Precious metals managed a second week of gains with gold adding 1.0% to close at $1426.70 an ounce. Silver, trying to catch up to gold’s recent jump, surged 6.3% to finish the week at $16.19 an ounce. In energy, crude oil reversed all of last week’s gain, giving up -7.4% and closing at $59.55 per barrel of West Texas Intermediate crude oil. The industrial metal copper, viewed by some analysts as a barometer of global economic health due to its wide variety of uses, gained 2.2%.
U.S. Economic News: The number of Americans filing for first-time unemployment benefits rose by 8,000 last week to 216,000, the Labor Department reported. That reading remains well below the key 300,000 threshold analysts use to indicate a “healthy” jobs market. Economists had estimated new claims would total a seasonally-adjusted 221,000. The less-volatile four-week average of new claims declined by 250 to 218,750. The four-week average usually gives a better read of labor market conditions than the more jumpy weekly number. Continuing claims, which counts the number of people already receiving benefits, fell by 42,000 to 1.69 million. The last time continuing claims were this low was in the early 1970’s.
Confidence among the nation’s homebuilders rose earlier this month, but still lagged from the same time last year. The National Association of Home Builders (NAHB) builder sentiment index rose one point to 65 in July, matching economists’ forecasts. In the details of the report, the readings of current sales conditions and expectations for the next six months each rose a point to 72 and 71, respectively. However, the index that tracks buyer traffic remained below the neutral line at 48. At a reading of 65, the headline index is much higher than the 58 level at which it began the year. But the year-to-date average is 63 is still below last year’s 67, and 68 in 2017.
The number of new homes under construction fell slightly last month and the number of permits sank to the lowest level in two years, suggesting lower mortgage rates haven’t boosted the housing market as much as anticipated. The Commerce Department reported that housing starts slipped 0.9% to an annual pace of 1.25 million last month, slightly exceeding economists’ forecasts of a reading of 1.24 million. In addition, the number of permits to build new homes sank 6.1% to a 1.22 million annual pace. That’s the lowest level since mid-2017. By region, housing starts rose in the Northeast and the Midwest, however they slowed in the South and the West. In the details, single-family house construction rose by 3.5% and accounted for 68% of the new starts, while work on multi-family projects of five or more units slipped after soaring to an 18-month high in May.
The University of Michigan’s Consumer Sentiment Index edged up this month, remaining near a 15-year high. The index edged up 0.2 points to 98.4 even in the face of rising economic headwinds. Economists had forecast a reading of 99.0. In the details, the gauge that measures what consumers think about their own financial situation slipped 0.8 point to 111.1, but the measure that surveyed expectations for the next six months advanced to 90.1 from 89.3. Consumer spending represents about 70% of what happens in the U.S. economy and Americans have plenty of reasons to feel good. Incomes are rising, layoffs and unemployment are near a 50-year low and plenty of jobs are available.
Sales at the nation’s retailers rose for the fourth consecutive month, suggesting that the economy is not as fragile as the media (and apparently the Federal Reserve) believe. The Commerce Department reported retail sales increased 0.4% in June, exceeding economists’ expectations of a 0.1% gain. Stripping out fuel sales, the increase was even larger - up 0.7% - as falling oil prices caused a big drop in sales at gas stations. In the details, internet retailers led the way with a 1.7% increase in sales, with restaurants, grocers, home-furnishing stores, and clothing outlets also gaining.
In New York State, manufacturing activity rebounded out of negative territory back into expansion. The Federal Reserve Bank of New York’s Empire State Survey rose 12.9 points to 4.3 in July, vs economists’ expectations of a reading of 0.5. The gain partially reversed June’s steep plunge to -8.6, its lowest level since October 2016. In the new details, the subcomponents were mixed. New orders rose in July but remained in negative territory at -1.5, while the shipments index moved lower to 7.2. The index for number of employees slid to its lowest level in almost three years. The outlook for growth in the next six months improved slightly, but remained notably weaker than in late 2017 and early 2018.
In the city of ‘Brotherly Love’, manufacturing rebounded to its highest reading in a year, according to the Federal Reserve Bank of Philadelphia. The Philly Fed said its gauge of business activity in its region rebounded strongly in July after hitting its lowest level in four months in June. The bank’s index rose to 21.8 in July from just 0.3 in June. Economists had expected a reading of just 4.5. In the details, the barometer of new orders increased 11 points to 18.9, while the shipments index added 8 points to 24.9. The measure for “outlook over the next 6 months” rose 17 points to 38. In an answer to a special question, 51% of the manufacturers surveyed said they have seen a “modest” increase in demand for their products over recent months.
The Federal Reserve reported that nationwide activity in the U.S. factory sector declined in the second quarter, its second straight quarterly decline. After a -1.9% decline in the first quarter, the second quarter saw a further -2.2% decline. Federal Reserve Chairman Jerome Powell cited the weak factory sector as one reason policymakers support cutting interest rates. Ian Shepherdson, chief economist at Pantheon Macroeconomics stated, “The sector is in recession. That’s not news; it’s a consequence of China’s cyclical slowdown and the trade war. We expect another tough quarter in Q3, but by Q4 we think a trade deal will have been done and China’s economy will be turning up.”