In the markets:
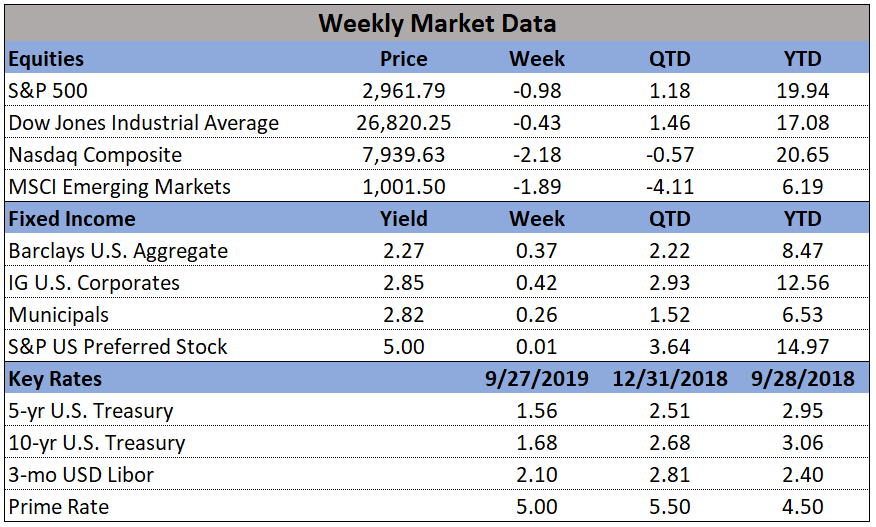
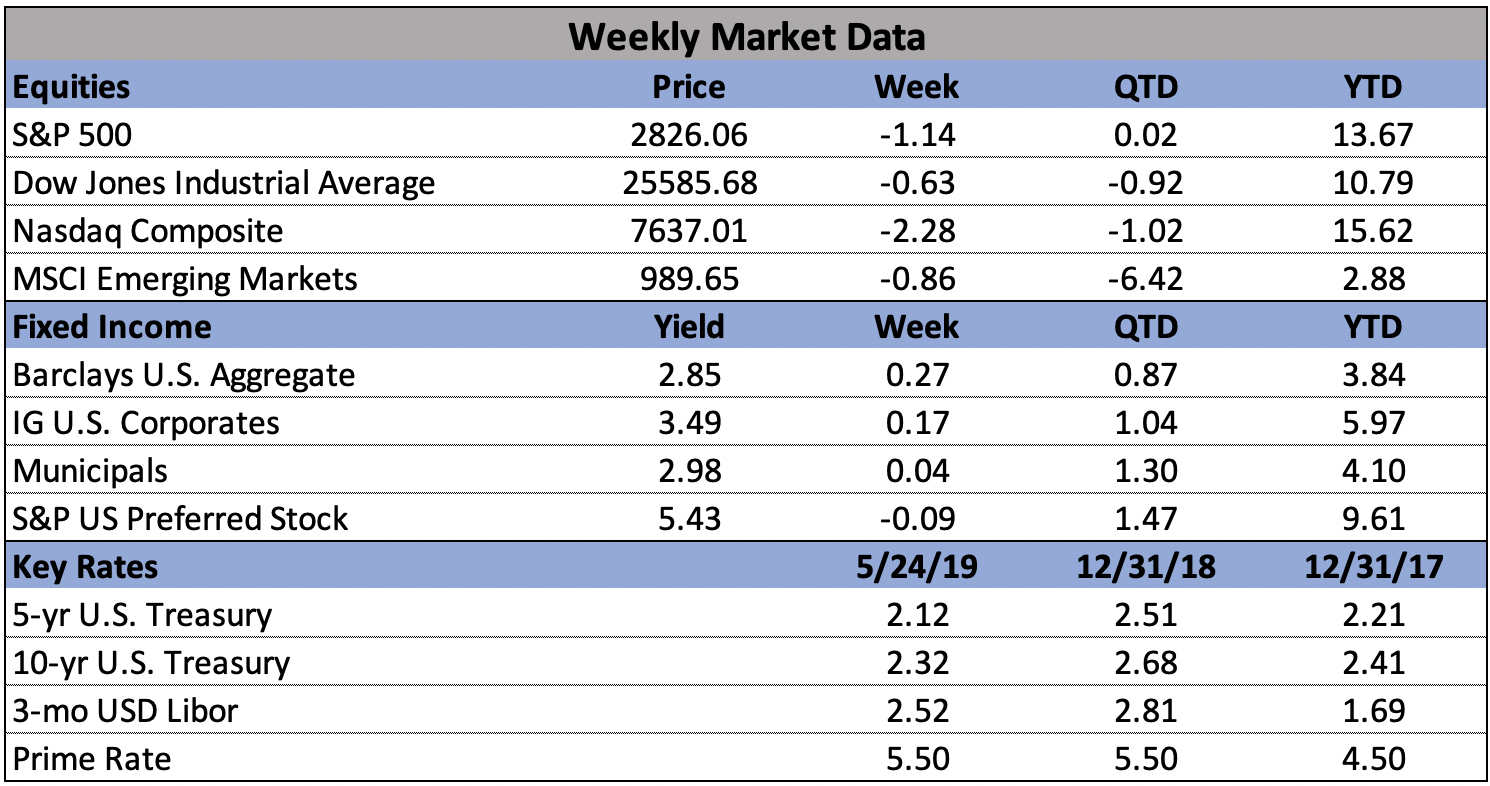
U.S. Markets: Stocks in the U.S. ended the week lower, with the technology-heavy NASDAQ Composite bearing the brunt of the selling. The Dow Jones Industrial Average ended the week down 178 points to 25,585, a decline of -0.7%. The NASDAQ declined for a third consecutive week, giving up -2.3%. By market cap, the large cap S&P 500 ended down -1.2%, while both the mid cap S&P 400 and small cap Russell 2000 ended down -1.4%.
International Markets: Canada’s TSX declined -1.1% while in Europe major markets were also a sea of red. The United Kingdom’s FTSE 100 ended down -1%, while on the mainland France’s CAC 40 retreated -2.2%, Germany’s DAX ended down -1.9%, and Italy’s Milan FTSE slumped -3.5%. In Asia, China’s Shanghai Composite declined for a fifth consecutive week, down -1%, while Japan’s Nikkei ended down -0.6%. As grouped by Morgan Stanley Capital International, developed markets managed a 0.02% gain, while emerging markets ended down -0.8%.
Commodities: Precious metals managed to get bid higher in the midst of the weakness in the equities markets, with Gold rising $7.90 to $1283.60 an ounce, a gain of 0.6%, while Silver rebounded 1.2% to $14.56 an ounce. But oil plunged this week, giving up -6.8% and closing at $58.63 a barrel. The industrial metal copper, viewed by analysts as a barometer of global economic health due to its wide variety of uses, finished down a sixth consecutive week, dropping -1.4%.
U.S. Economic News: The number of Americans seeking first-time unemployment benefits downticked by 1,000 to 211,000, remaining near a 50-year low and signaling that the U.S. jobs market remains strong. Economists had expected new claims would rise to 217,000. The more stable monthly average of new claims fell by 4,750 to 220,250. Continuing claims, which counts the number of people already receiving benefits, rose slightly to 1.68 million. That number is reported with a one-week delay.
New-home sales declined 7% last month after reaching the best level of the latest cycle. The Commerce Department reported new-home sales were at a seasonally-adjusted 673,000 annual rate in April, slightly exceeding the consensus forecast for a 670,000 pace of sales. Despite the decline, the trend in new-home sales remains solidly up. March’s revised sales figures were the highest since October 2007, and there were upward revisions to every month back to December. Sales were 7% higher than April of last year. In the details, the median sales price in April, $342,200, was 8% higher than a year ago. At the current pace of sales, it would take 5.9 months to exhaust available supply, about matching the 6 months that has traditionally been considered the marker of an evenly balanced market.
Sales of existing homes fell for the second consecutive month last month, according to the National Association of Realtors (NAR). The NAR reported existing-home sales ran at a seasonally-adjusted annual rate of 5.19 million. That was 0.4% lower than March and 4.4% lower than the same time last year. The number missed economists’ expectations of a 5.35 million selling pace. In the details, the median selling price in April was $267,300, a 3.6% annual increase. At the current pace of sales, there is a 4.2 month supply of homes available on the market—well below the 6-month threshold that’s generally considered to be a balanced housing market. Properties stayed on the market for an average of 24 days in April. By region, sales were down 4.5% in the Northeast and 0.4% in the South. They were flat in the Midwest and up 1.8% in the West.
With less demand from both domestic and foreign buyers and a flare-up in U.S.-China trade tensions, American manufacturers grew at their slowest pace since before U.S. President Donald Trump was elected, research firm IHS Markit reported. Markit’s “flash” survey of U.S. manufacturers declined to a nine-and-a-half year low of 50.6 this month, down 2 points from April. Analysts note that even more ominously, the firm’s survey of U.S. service-oriented companies such as banks and retailers declined almost 2 points to a 39-month low of 50.8 – ominous because services companies employ about 80% of all U.S. workers. Although numbers over 50 indicate companies are growing, the sharp declines in both the manufacturing and services indexes suggest the economy could slow in the months ahead—especially if the dispute with China drags on.
Activity in the manufacturing sector was a significant drag on overall economic activity in April, according to the Chicago Federal Reserve’s National Activity Index (CFNAI). The CFNAI registered -0.45 in April, down from 0.05 in March. Due to the index’s volatile nature, a smoothed three-month moving average is used to analyze trends. The three-month average decreased to -0.32 in April, down from -0.24 in March. The CFNAI is a weighted average of 85 economic indicators, designed so that zero represents trend growth and a three-month average greater than 0.70 suggests an increasing likelihood of increased inflation. Production-related indicators, meaning factory-related, declined to -0.44 in April, down from -0.04 in March. In the details, 33 of the 85 indicators made positive contributions, while 52 weighed.
The Commerce Department reported that orders for goods expected to last at least three years, so-called “durable goods”, dropped 2.1% last month. The decline was attributed to falling demand for Boeing aircraft as well as new cars and trucks. However, of greater concern was that business investment continued to weaken as the trade dispute with China escalated. The big drop in orders was mostly attributed to a drop-off in orders for Boeing jetliners. The giant manufacturer received just four orders in April following the worldwide suspension of flights of its 737 MAX planes. Even after stripping out both aircraft and defense spending, core capital-goods orders declined for the first time in four months, down -0.9%. These orders strip out both aircraft and defense spending to get a better read on how much the private sector is investing. The yearly pace of business investment slowed in April to 1.3% from 3.8%, marking the smallest annual increase since the final month of Barack Obama’s presidency in January 2017.
Minutes from the Federal Reserve’s last interest-rate meeting showed that members felt comfortable with their “patient” stance on rates, and agreed that it could last for “some time”. The Fed Open Market Committee (FOMC) held its target range for the federal-funds rate at 2.25% to 2.5%. “Members observed that a patient approach to determining future adjustments to the target range for the federal-funds rate would likely remain appropriate for some time, especially in an environment of moderate economic growth and muted inflation pressures, even if global economic and financial conditions continued to improve,” the minutes said. The minutes further noted that officials were split on the outlook for interest rates over the longer term. Ian Shepherdson, chief economist at Pantheon Macroeconomics wrote in a note, “No one is pushing for a near-term shift in policy, in either direction.”