In the markets:
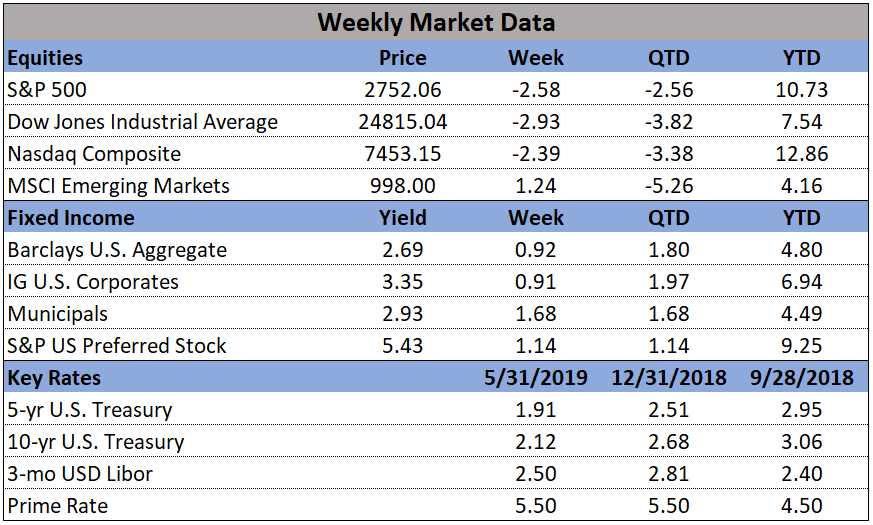
U.S. Markets: U.S. stocks fell sharply and closed out their worst month since December as trade tensions ratcheted higher. Small caps, which are usually thought to be less sensitive to global trade tensions than their larger peers, nonetheless performed the worst, and the S&P 400 mid cap index joined small caps in correction territory—defined as more than 10% down from a recent high. The Dow Jones Industrial Average gave up 770 points last week, losing the 25,000 level, and closing at 24,815—a loss of -3.0%. The technology-heavy NASDAQ Composite gave up -2.4% and closed the week at 7,453. By market cap, the large cap S&P 500 declined -2.6%, the mid cap S&P 400 index retreated -2.8%, and the small cap Russell 2000 gave up -3.2%.
International Markets: Canada’s TSX finished down for the fourth week of the last five, losing -1.2%. Across the Atlantic, the United Kingdom’s FTSE fell -1.6%, while on Europe’s mainland France’s CAC 40 retreated -2.1%, Germany’s DAX declined -2.4%, and Italy’s Milan FTSE gave up -2.8%. In Asia, China’s Shanghai Composite gained 1.6%, while Japan’s Nikkei 225 declined -2.4%. As grouped by Morgan Stanley Capital International, developed markets fell -2.1%, while emerging markets rose rebounded 1.9%.
Commodities: Precious metals rose on the weakness in equity markets. Gold rallied 2.1%, or $27.50, to $1311.10 per ounce. Silver managed a 0.1% gain ending the week at $14.57 per ounce. Energy plunged, with West Texas Intermediate crude oil giving up -8.8% and finishing the week at $53.50 per barrel. The industrial metal copper, viewed by analysts as a barometer of global economic activity due to its wide variety of uses, finished the week down -2.2%. Copper has now closed lower for seven consecutive weeks.
May Summary: All major U.S. and International stock markets lost ground in May. The Dow Jones Industrial Average retreated -6.7%, the Nasdaq Composite retreated -7.9%, and the large cap S&P 500 gave up -6.6%. Small caps fell -7.9% and mid caps fared the worst giving up over -8.1%. Canada’s TSX fell -3.3% while the United Kingdom’s FTSE gave up -3.5%. On Europe’s mainland, France’s CAC 40 fell -6.8%, Germany’s DAX retreated -5%, and Italy’s Milan FTSE plunged -9.5%. In Asia, China’s Shanghai Composite fell -5.8% and Japan’s Nikkei retreated -7.5%. Developed markets ended the month down -5.0%, while emerging markets fell an even deeper -7.3%. Precious metals ended the month mixed: Gold rose 2.0% while Silver declined -2.7%. West Texas intermediate crude oil plunged a whopping -16.3%, while copper gave up -9.1%.
U.S. Economic News: The number of Americans seeking first time unemployment benefits rose slightly to 215,000, but remained near multi-decade lows. The Labor Department reported initial jobless claims rose by 3,000 last week, matching economists’ estimates. The less-volatile monthly average of new claims fell by 3,750 to 216,750. Continuing claims, which counts the number of people already receiving unemployment benefits, declined by 26,000 to 1.66 million. That number is reported with a one-week delay.
The number of homes where a contract has been signed but has not yet closed fell a seasonally-adjusted 1.5% in April and were 2% lower than the same time last year, according to the National Association of Realtors (NAR). Contract signings precede closings by about 45-60 days, so the pending home-sales index is a leading indicator for upcoming existing-home sales reports. By region, only the Midwest saw an increase, with a 1.3% rise. Pending sales were down 1.8% in the Northeast, 2.5% in the South, and 1.8% in the West. Despite the declines, the NAR remained resoundingly upbeat. NAR Chief Economist Lawrence Yun stated, “It’s inevitable for sales to turn higher in a few months.”
The rate of increase in home prices weakened again according to the latest data from S&P CoreLogic. The S&P CoreLogic Case-Shiller home price index rose an annualized 3.7% in March, down from 3.9% in February. As recently as last fall many regions had reported double-digit price increases. The latest report’s largest annual gain was 8.2% in Las Vegas, but Seattle’s previous 13% gain has dropped to just 1.6%. The 20-City Composite index dropped from 6.7% annual gains, to just 2.7% over the past year. David Blitzer, managing director and chairman of the Index Committee at S&P Dow Jones Indices stated, “Given the broader economic picture, housing should be doing better.”
Confidence among the nation’s consumers surged in May to a six-month high, spurred by a robust labor market. The Consumer Confidence Index rose 4.9 points to 134.1 the Conference Board reported. Of note, the survey results were compiled before trade talks between the U.S. and China deteriorated. In the details, the survey that asked Americans how they view the economy at present rose to 175.2—its highest level since December 2000. In addition, the index that tracks how consumers view the economy 6 months from now rose 3.9 points to 106.6. Lynn Franco, director of economic indicators at the Board stated, “Despite weak retail sales in April, these high levels of confidence suggest no significant pullback in consumer spending in the months ahead.”
Americans cut back on spending in April after a surge in March, according to the Commerce Department. Consumer spending rose 0.3% last month, a steep drop from March’s 1.1% increase. Incomes rose 0.5% in April, the largest gain in four months while the Personal Consumption Expenditures index rose 0.3%. The rate of inflation over the past year rose to 1.5%--its highest level since December. Sal Guatieri senior economist at BMO Capital Markets stated, “Despite an escalating trade war, the American consumer is still kicking, and likely to keep the economy moving forward so long as hiring doesn’t give out.”
Consumer sentiment took a hit in the last half of May after the trade dispute between the U.S. and China escalated into another round of retaliatory tariffs. The University of Michigan’s final results for consumer sentiment was lowered 2.4 points to 100 in May, down from its highest reading in 15 years. In the details, over 30% of respondents “spontaneously” mentioned the new tariffs versus just 16% earlier in the month.
First-quarter GDP grew a bit slower than originally reported, predominantly due to weaker business investment, said the government’s Bureau of Economic Analysis. Gross domestic product, the official scorecard for the economy grew at a 3.1% annual pace in the first quarter—down a tick from the initial 3.2% estimate. Economists had expected first-quarter GDP to be revised down to 3%. Of note in the report, adjusted corporate profits before taxes fell at an annual -2.8% pace—the biggest decline since 2015. Chief Economist Scott Brown of Raymond James summed up the report writing, “The first quarter story remains the same — headline GDP growth was boosted by inventories and net exports, while consumer spending and business fixed investment rose at a lackluster pace.”
Looking ahead:
FAANG (Facebook, Apple, Amazon, Netflix, Google) took a hit Monday, June 3 as news spread about the Department of Justice's investigations into Google concerning potential monopolies and "anti-competition mergers and acquisitions". If anti-trust litigation is brought against one of these companies, there is a high probability others will be investigated. Other sectors are also consolidating, particularly healthcare and industrials, putting other large companies at risk.
Why is this important? Because companies like these have enormous influence over the health of the indexes that include them. Both the S&P 500 (a market-cap-weighted index) and the Dow Jones (a price weighted index) are dominated by FAANG stocks. 6% corrections, as Google experienced this morning, are capable of moving the entire index by more than a tenth of a percent. This means that if the constituents of FAANG all move into negative territory, it can result in a ~1% decline in the index even if all other stocks are in the green.