In the markets:
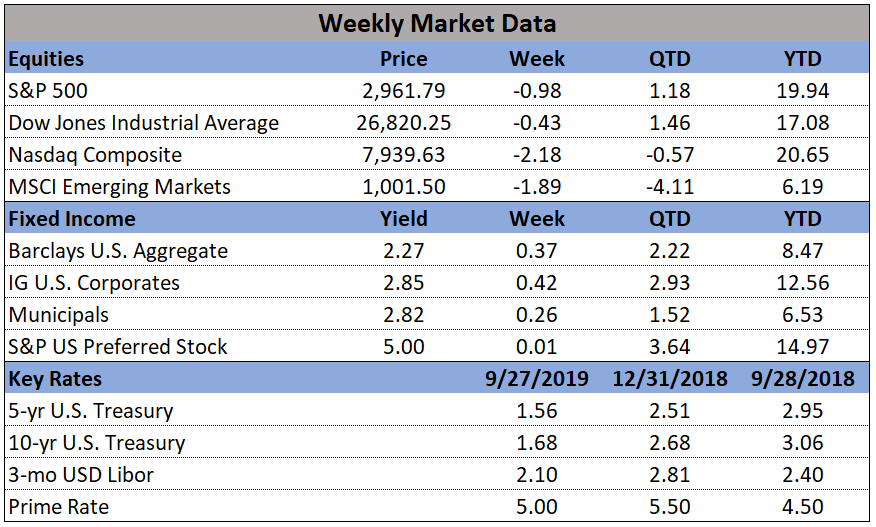
U.S. Markets: U.S. equities recorded losses for the week as concerns over trade and political uncertainty re-emerged. For the second week, small-cap indexes underperformed large-caps and within the S&P 500 the typically defensive utilities sector outperformed. The Dow Jones Industrial Average retreated -0.4% to close at 26,820. The technology-heavy NASDAQ Composite fell -2.2%, back below the 8,000-level to 7,939. The large cap S&P 500 fell -1.0%, the mid cap S&P 400 gave up -1.1%, and the small cap Russell 2000 brought up the rear with a -2.5% loss.
International Markets: Canada’s TSX retraced almost all of last week’s gain by falling -1.2%, while the United Kingdom’s FTSE gained 1.1%. On Europe’s mainland, France’s CAC 40 declined -0.9%, Germany’s DAX fell -0.7%, and Italy’s Milan FTSE ended down -0.5%. In Asia, China’s Shanghai Composite retreated -2.5% and Japan’s Nikkei declined -0.9%. As grouped by Morgan Stanley Capital International, emerging markets declined -2.3% while developed markets ended down -0.9%.
Commodities: Precious metals didn’t get the usual benefit from the weakness in the equities markets. Instead, Gold gave up -0.6% to close at $1506.40 an ounce and Silver declined -1.1% to $17.65. Oil retraced all of last week’s gain and then some by falling -3.8% to $55.91 per barrel for West Texas Intermediate crude. The industrial metal copper, seen by some analysts as a barometer of global economic health due to its wide variety of uses, ended the week down -0.4%.
U.S. Economic News: The number of Americans seeking first-time unemployment benefits rose slightly last week, predominantly due to a UAW strike at many General Motors plants. The Labor Department reported initial jobless claims increased by 3,000 to 213,000 in the week ended September 21. Economists had expected new claims would total 211,000. Overall, however, new claims nationwide remained near a 50-year low. In the report, applications for benefits in Michigan more than doubled to 7,724 from the prior week, accounting for more than all of the weekly national gain.
The increase in the price of homes slowed to a crawl in July, according to the latest data from S&P/Case-Shiller. The S&P CoreLogic Case-Shiller 20-city home price index held steady for the month of July, but on an annual basis, the index increased by just 2%. This represents the slowest rate of home-price appreciation since 2012. Furthermore, between June and July, home prices rose in only 14 of the 20 large cities that the Case-Shiller index tracks (and most of those increases were relatively small). Phoenix and Las Vegas continued to experience the highest rate of home-price growth, while Seattle remained the only city where home prices have actually declined over the past year. Nationally (above and beyond the 20 cities in the index), Case-Shiller reported that home prices were up 3.2% in July from the same time last year. That is slightly higher than the 3.1% increase posted in June.
The number of sales of homes in which a contract has been signed, but not yet closed, rose last month, led by gains in the West. The National Association of Realtors (NAR) reported its index of pending home sales increased 1.6% last month. The reading was a welcome rebound from July’s decline. Compared with the same time last year, contract signings were up 2.5%. Notably, this is only the third month this year in which contract signings have risen and pending home sales increased across all regions. The highest gain occurred in the West, where the pending home sales index rose 3.1% from July. Contract signings also increased 0.7% in the Northeast, 0.6% in the Midwest and 1.4% in the South. Lawrence Yun, chief economist for the NAR, said in the report “The notable sales slump in the West region over recent years appears to be over. Rising demand will reaccelerate home price appreciation in the absence of more supply.”
Orders for goods expected to last at least 3 years, so-called “durable goods”, rose slightly last month, but the increase was largely military-related. Stripping out Pentagon-related orders, the report was rather soft, adding to a picture of a slowing U.S. economy. The Commerce Department reported orders for durable goods increased 0.2% last month. Economists had forecast a decline of -0.7%. Yet if military orders are set aside, bookings were down -0.6%. In the report, orders surged 15% for defense capital goods, which includes things like aircraft, ships, tanks, and weapons systems. However, demand waned for new cars and trucks, computers, and appliances. “Core” orders, which strip out the volatile military and aircraft categories, declined -0.2% in August. These orders have fallen slightly over the past year, a decline that began with the trade dispute with China. BMO Senior Economist Sal Guatieri stated, “Trade protectionism continues to gum up U.S. manufacturing largely by undermining business investment.”
Market research firm IHS Markit stated the U.S. economy stabilized this month, according to two of its surveys. Following an episode of trade-related weakness toward the end of summer, the U.S. economy returned to slight growth, according to IHS Markit. Their flash manufacturing index rose to a 5-month high of 51 this month, up from 50.3 in the prior month, while its flash services index edged up 0.2 points to 50.9. However, while trade tensions have eased a bit, business executives are still on edge. Both IHS indexes remain near multi-year lows and sit just above the cutoff line that separates expansion from contraction. Most notably, employment levels in the services side of the economy declined for the first time in almost 10 years. This is particularly significant as more than 80% of American workers are employed in service-oriented companies such as retail, finance, health care, and education.
Confidence among American consumers fell to a 3-month low as trade tensions continued to escalate between the U.S. and China. The Conference Board reported its Consumer Confidence index dropped 9.1 points to 125.1 in September. Economists had expected a reading of 131.1. The decline puts the index at its lowest level since June and well off the post-recession peak of 137.9 set almost a year ago. In the details, the index that measures how consumers feel about the present fell sharply, as did the survey that measures expectations over the next 6 months. The so-called expectations index dropped to 95.8 from 106.4, the lowest reading since January. Consumer confidence is especially important as the U.S. economy is dependent on robust household spending to keep the economy growing. Jim Baird, Chief Investment Officer at Plante Moran Financial Advisors stated, “With business investment and trade both weighing on the economy, the importance of consumer spending at this juncture can’t be overstated.”
Consumers cut back on their spending in August and boosted their savings, but analysts believe the spending pause will be short-lived as incomes rise. The Commerce Department reported consumer spending rose 0.1% last month—its smallest increase in six months. Economists had expected an increase of 0.3%. Incomes rose for the fifth time in six months, up 0.4%, but most of it ended up in savings. The savings rate rose 0.3% to a healthy 8.1%. In addition, the report noted the Federal Reserve’s preferred measure of inflation - the Personal Consumption Expenditures (PCE) Index - remained flat with the core rate (which excludes food and energy) up just 0.1%. The increase in the PCE price gauge over the past 12 months was unchanged at 1.4%, well below the Fed’s 2% target.
The Commerce Department confirmed the U.S. economy grew more slowly in the second quarter, according to updated figures. The official scorecard for the U.S. economy, Gross Domestic Product (GDP), grew at a 2% annual pace from April through June. The reading remained unchanged from its previous estimate. Analysts expect the slow growth to persist through the end of the year largely due to the festering trade dispute with China. In the details, consumer spending was very strong in the spring, rising 4.6%. Consumer spending accounts for almost 70% of all U.S. economic activity. However, business investment declined a steeper 1.4% versus the 1.1% originally reported. Most other figures in the GDP report were little changed. GDP is revised twice after the initial release to take into account new or more accurate information.