In the markets:
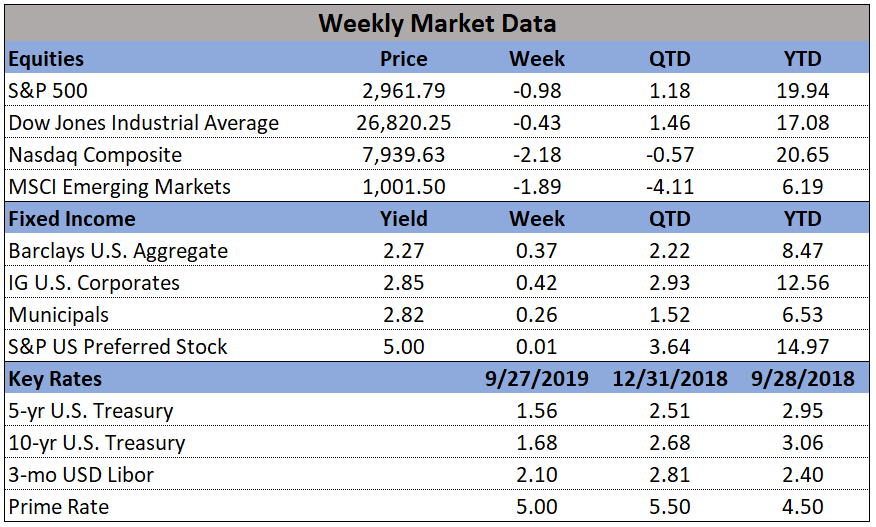
U.S. Markets: The major U.S. indexes were mixed for the week. The large-cap benchmarks retreated from the record highs established the previous week, while the S&P 400 Mid Cap Index and Small Cap Russell 2000 index recorded modest gains. The Dow Jones Industrial Average declined 119 points to end the week at 26,600, a loss of -0.5%. The technology-heavy NASDAQ Composite gave up -0.3% but held the 8,000-level closing at 8,006. By market cap, the large cap S&P 500 fell by -0.3%, while the S&P 400 gained 0.9%, and the small cap Russell 2000 added 1.1%.
International Markets: Canada’s TSX retreated -0.9%, while the United Kingdom’s FTSE gained 0.2%. Major markets were mixed on Europe’s mainland with France’s CAC 40 and Germany’s DAX rising 0.2% and 0.5%, respectively, while Italy’s Milan FTSE finished down -0.7%. In Asia, China’s Shanghai Composite fell -0.8% and Japan’s Nikkei ticked up 0.1%. As grouped by Morgan Stanley Capital International, developed markets rose 0.6%, while emerging markets added 0.3%.
Commodities: In commodities, Gold rose as high as $1442 an ounce before settling back and closing at $1413.70, a gain of 1%. Silver also finished the week up, gaining 0.33%. Crude oil had its second week of gains, rising 1.8% to close at $58.47 per barrel. The industrial metal copper, viewed by analysts as a barometer of global economic health due to its wide variety of uses, ended the week essentially flat, up just 0.04%.
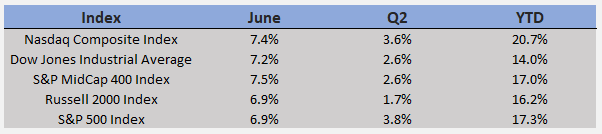
June and Q2 Summary, US Markets: It was a great June and a good Q2 for US markets. May’s declines were recovered in June, and then some.
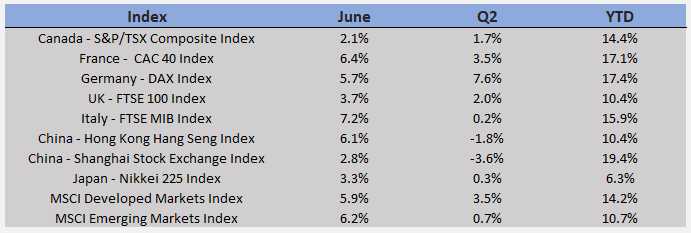
June and Q2 Summary, International Markets: As in the U.S., a strong June salvaged the quarter for most international indexes, with only Italy and the two Chinese indexes logging a negative quarter. Double-digit year to date returns are the rule for all but Japan’s Nikkei.
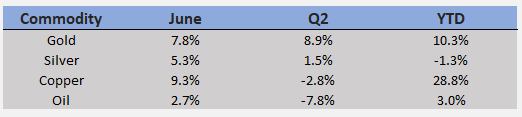
June and Q2 Summary, Commodities: Major commodities were up in June, but had a mixed Q2. After a very strong Q1, oil slumped in Q2, but still leads the way among commodities, up 28.8% for the year to date. Copper was down the most in Q2 as continued economic growth came into question. Gold and silver usually move in parallel directions, but have gone their own ways so far this year, with gold nicely up and silver down for the year to date.
U.S. Economic News: The number of Americans applying for first-time unemployment benefits rose to a 7-week high of 227,000 last week. Economists had estimated new claims would total a seasonally adjusted 216,000. Analysts generally look at the less-volatile monthly average of new claims, which increased only 2,250 to a still remarkably low 221,250. Analysts consider readings below 300,000 a “healthy” jobs market. The number of Americans already collecting benefits, so-called continuing claims, rose slightly to 1.69 million and remains near multi-decade lows. The nation’s strong labor market continues to support the U.S. economy in the face of rising headwinds such as the trade dispute with China, weaker global economy, and slowing growth among manufacturers and homebuilders.
Sales of new single-family homes fell to a 5-month low in May, falling for the second month in a row. The Commerce Department reported new-home sales ran at a 626,000 seasonally adjusted annual rate in June. Economists had expected a 669,000 pace. Sales were down 7.8% compared to April and down 3.7% from the same time last year. At the current pace of sales, it would take 6.4 months to exhaust the available supply. Analysts generally consider 6 months a “balanced” housing market. The median price of a new home sold in May was $308,000—2.7% lower than a year ago. Note that the Commerce Department’s data on new residential construction are based on small sample sizes and are often significantly revised. Year to date, sales are 4.0% higher than the same period a year ago.
The National Association of Realtors (NAR) reported the number of homes under contract, but not yet closed, rose by a seasonally-adjusted 1.1% in May, but was 0.7% lower than the same time last year. The increase in May beat the consensus forecast for a 0.6% rise. May’s reading marked the 17th consecutive month of declines on an annual basis. By region, NAR reported pending sales in the Northeast were 3.5% higher, 3.6% higher in the Midwest, down -1.8% in the West and up 0.1% in the South.
Home prices were flat in April according to the S&P Case-Shiller 20-city home price index. April was the 13th straight month in which annual growth slowed, and the lowest pace of annual gains since August of 2012. The cities with the strongest gains continue to be those in warm climates, but their rates of price growth are nowhere near the double-digit gains seen in Seattle and San Francisco not long ago. In the details, the slowest monthly pace of change was in New York, which was flat, while the slowest annual growth was in Seattle—also unchanged. Economists at Oxford Economics wrote in a note to clients, “Signs of a global house price downturn are already visible, with around a third of our sample of economies seeing falling prices and world residential investment starting to decline. High house price valuations add to the risk that this downturn will deepen in the coming quarters, hitting consumer spending.”
Confidence among the nation’s consumers fell to an almost 2-year low as trade tensions with China continue to escalate. The Conference Board reported its consumer confidence index plunged this month to 121.5 from a revised 131.1 in May. The reading was its weakest since September of 2017 and far below economists’ expectations for a reading of 130.4. The decline adds to mounting evidence showing slowing U.S. economic growth and more pessimism about the future. In the details, the measure of how Americans see the current economy slid 8 points to a one-year low of 162.6. In addition, more Americans said jobs were harder to get than in the prior month—16.4% versus 11.8%. However, the survey was conducted in mid-June when President Trump had threatened to apply tariffs to all Mexican imports and before the surge in U.S. equity markets that has pushed equities back to near-record highs. The University of Michigan reported its survey of consumer sentiment also declined this month with households with incomes in the top third responsible for the majority of the decline. The University of Michigan said the final reading of its consumer sentiment index in June was 98.2, down from the 100 reading in May. Economists expected a reading of 98.
A measure of business activity in the Windy City fell into contraction in June for the first time in two years. The Chicago Purchasing Managers’ Index (PMI) declined to 49.7 this month, down from 54.2 in May. The index was as high as 64.7 just four months ago. The survey found that a whopping 80% of firms said the trade tariffs had negatively impacted their businesses, with rising prices leading to a pullback in orders. Shaily Mittal, senior economist at MNI Indicators stated, “With customers rethinking their purchases, demand tumbled, and consequently firms pulled back production, weakening overall sentiment.” PMI values less than 50 are in contraction territory.
Orders for goods expected to last at least 3 years, so-called “durable goods”, dropped 1.3% last month, its third decline in the last four months. Economists had expected only a 1% decline. The main catalyst appears to have been a sharp decline in orders for Boeing’s 737 Max jet. Boeing has received barely any orders since Max flights were suspended following a pair of deadly crashes earlier this year. On a positive note, orders for autos rose 0.6% in May, along with orders for heavy machinery, primary metals, computers, and networking gear. In addition, a key measure of business investment, core orders, advanced 0.4% last month—its biggest increase since the beginning of the year. Economist Andrew Hollenhorst of Citi Research wrote in a note, “The stronger-than-expected increase in core capital goods orders is a positive sign that underlying investment has not softened further despite overall weakness in industrial sector activity.”