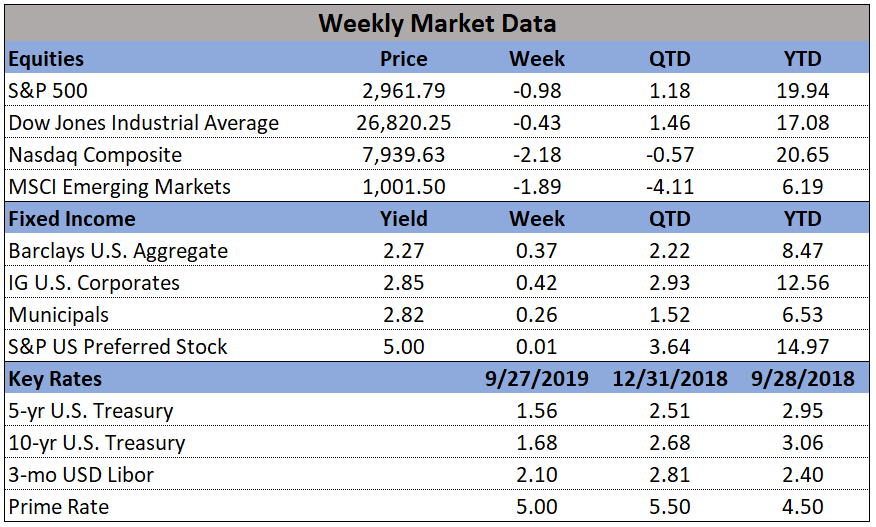
The majority of major U.S. stock indexes ended positive for the week (thanks to a burst higher on Friday), with the technology-heavy NASDAQ Composite index performing the best. Our Short Term Indicator changed to Bullish for the past week.
-
The NASDAQ Composite rose 1.35% to close at 7,337. By market cap, large caps outperformed smaller caps with the S&P 500 large cap index rising 0.55%, while the S&P 400 mid cap and Russell 2000 small cap indexes added 0.16% and 0.37%, respectively.
-
Across the Atlantic, the United Kingdom’s FTSE slipped -0.69%, while France’s CAC 40 rose 0.68%, Germany’s DAX gained 0.26%, while Italy’s Milan FTSE slipped -0.55%. In Asia, China’s Shanghai Composite rebounded sharply for the second week, jumping 2.8%, while Japan’s Nikkei added 0.8% and Hong Kong’s Hang Seng rose 0.5%. As grouped by Morgan Stanley Capital International, developed markets slipped ‑0.1% while emerging markets rose 0.4%.
-
Energy rose for a second week with West Texas Intermediate crude oil rising 3.25% to close at $63.55 per barrel. Precious metals gave back much of last week’s gains with Gold falling -$25.90 to close at $1330.30 an ounce, a loss of -1.9% and Silver giving up -1.4% to close at $16.48. Copper, viewed by some analysts as an indicator of global economic health due to its variety of uses, also gave back some of last week’s gain by falling ‑1.1%.

-
New claims for unemployment benefits dropped by 7,000 to 222,000, reclaiming their 45-year low last week. This reading marked the second lowest level since the end of the 2007-2009 recession. Economists had forecast 230,000 new claims. The less-volatile four-week average of new claims declined by 2,250 to 226,000. Claims are now down to their lowest levels since the early 1970’s. Most firms continue to report shortages of qualified workers, and the unemployment rate is at a 17-year low. Continuing claims, which counts the number of people already collecting unemployment benefits, dropped by 73,000 to 1.88 million.
-
Sales of existing homes plunged at their fastest rate in over 3 years as the available supply of homes continues to shrink. Existing-home sales were at a seasonally-adjusted annual pace of 5.38 million in January, according to the National Association of Realtors (NAR). The NAR notes that available supply is still the major factor weighing on the housing market – there’s no shortage of demand. At the current sales pace, there’s just 3.4 months of inventory available, which is especially lean compared to traditional averages.
Please visit our website www.pacificinvestmentresearch.com for more insights. Email us at info@pacificinvestmentresearch.com if you have any questions.


