In the markets:
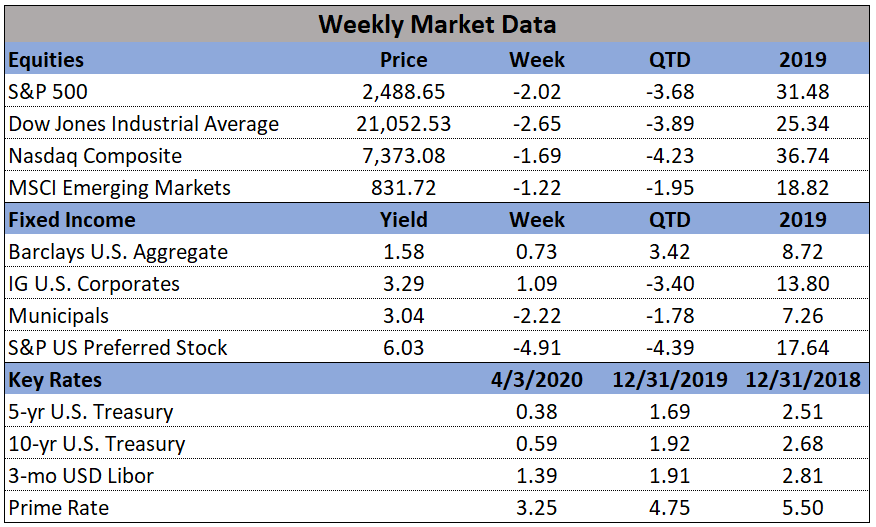
U.S. Markets: The major indexes closed lower for the week and rounded out their worst monthly and quarterly performances since 2008. The smaller-cap indexes trailed by a large margin, with the small-cap Russell 2000 falling about 7% in a single-session on Wednesday. The Dow Jones Industrial Average gave up 584 points to finish the week at 21,053, a decline of -2.7%. The technology-heavy NASDAQ Composite retreated -1.7%, while the large cap S&P 500 ended down -2.1%. The small-cap Russell 2000 and mid-cap S&P 400 retraced a large portion of last week’s gains finishing down -7.1% and -6.0%, respectively.
International Markets: Canada’s TSX was the only major international index to manage a positive close last week, rising 2%. The United Kingdom’s FTSE 100 retreated -1.7%, while France’s CAC 40 and Germany’s DAX gave up -4.5% and -1.1%, respectively. In Asia, China’s Shanghai Composite fell just -0.3%, but Japan’s Nikkei plunged -8.1%. As grouped by Morgan Stanley Capital International, developed markets ended down -3.7%, while emerging markets declined -0.7%
Commodities: After two volatile weeks of trading, Gold ended the week down -0.5% to $1645.70 an ounce. Silver, likewise, finished the week down -0.3% closing at $14.49 per ounce. Crude oil staged a huge rally, soaring 31.8% to finish the week at $28.34 per barrel for West Texas Intermediate crude after having fallen to $20 during the week. Oil prices surged following a tweet from President Donald Trump that he expects Saudi Arabia and Russia to cut production. Copper, viewed by some analysts as barometer of global economic health due to its wide variety of industrial uses, gained 0.94% last week.
March and Q1 Summaries: For the month, the Dow Jones Industrial Average lost -13.7%, while the NASDAQ retreated -10.1%. By market cap, the large cap S&P 500 ended down -12.5%, while the mid-cap S&P 400 fell -20.4%, and the small cap Russell 2000 gave up -21.9%. In the first quarter of 2020, the Dow declined -23.2%, the NASDAQ fell -14.2%, and the S&P 500 ended down -20%. The S&P 400 declined a huge -30.0% while the Russell 2000 fell the most, -30.9%.
Major international markets were a sea of red in March and the first quarter as a whole as well. Canada’s TSX fell -17.7% in March, while the UK’s FTSE gave up -13.8%. France’s CAC 40 and Germany’s DAX lost -17.2% and -16.4%, respectively. China’s Shanghai Composite ended down -4.5% and Japan’s Nikkei declined -10.5%. Developed markets shed -14.1% and Emerging markets declined -15.8%. In the first quarter of 2020, Canada’s TSX fell -21.6%, while the United Kingdom’s FTSE, France’s CAC 40 and Germany’s DAX retreated -24.8%, -26.5%, and -25%, respectively. China’s Shanghai Composite finished down -9.8%, and Japan’s Nikkei lost -20.0%. Developed markets ended down -23.0%, and emerging markets fell -23.9%.
For the month of March, Gold gained 1.9%, but Silver finished the month down -14%. Oil and Copper retreated -54.0% and -12.3%, respectively. In the first quarter of 2020, Gold gained 4.8%, but Silver declined -21%. Oil cratered a huge -66.5%, while copper finished down -20%.
U.S. Economic News: The number of Americans who applied for first-time unemployment benefits last week broke the record set just the previous week, soaring an unprecedented 6.6 million. The reading brought the total for the past two weeks to 9,955,000 initial jobless claims. Assuming the labor force remains steady, this implies a staggering 9.6% unemployment rate—close to the 10% peak reached during the Great Recession. In the details, nearly all states saw jobless claims increase last week. Economists predict 25 million or more Americans could lose their jobs in the next few months—temporarily for some, but permanently for others. Even worse, the level of claims may still be under-represented. Some states continue to have trouble processing the huge influx of applications.
The economic fallout from COVID-19 was bigger and quicker than had been expected, the Labor Department reported. The government’s official employment scorecard for March showed a loss of 701,000 jobs, the most since March 2009. Analysts believe that number is certain to get far worse. The Labor Department’s employment summary for last month was gleaned from a survey of business establishments completed in the second week of March, just before the COVID-19 pandemic began to devastate the economy. The April report is on track to be devastating. Employment had risen for a record 113 straight months until the decline in March. The unemployment rate, meanwhile, rose to 4.4% from a 50-year low of 3.5% in February. The huge increase in jobless claims, however, suggests the rate has actually surged to around 10%.
The pace of home-price appreciation increased again in January, according to market data firm S&P CoreLogic. The S&P CoreLogic Case-Shiller 20-city price index posted a 3.1% year-over-year increase in January. The reading was up 2.8% from the previous month. Because of the two-month lag in the data, the effects of the coronavirus pandemic on the housing market are not yet known. In the report, Phoenix led the way with a more than 6.9% annual price gain in January, followed by Seattle, Tampa, and San Diego. In total, 14 of the 20 cities reported higher prices year-over-year in January.
Confidence among the nation’s consumers plunged as the coronavirus outbreak took hold across the country. The Conference Board reported its Consumer Confidence Index cratered 12.6 points last month, the most since August 2011. The reading hit 120.0, its lowest level since July of 2017. The only positive to the report was that analysts had expected an even lower reading of 110.0. Historically, such large drops in confidence have more often than not been associated with an economic recession. Notably, the survey cutoff date was before the record surge in jobless claims, suggesting that confidence will likely continue to slide in the near future. In the details of the report, the decline was led by a 19.9 point drop in consumer expectations, with outlooks for business conditions, job availability, and income all deteriorating. Consumer assessment of the present situation was not nearly as bad, with that index off just 1.6 points. Confidence was down across all demographic groups and most income categories. Furthermore, analysts aren’t expecting any improvement any time soon. Lynn Franco, senior director of economic indicators at the board stated, “March’s decline in confidence is more in line with a severe contraction — rather than a temporary shock — and further declines are sure to follow.” Similarly, Joshua Shapiro, the chief economist at MFR Inc., stated, “This report, along with the earlier downward revision to the March University of Michigan consumer sentiment index, is in all likelihood just a taste of the steep declines that loom ahead.”
The Institute for Supply Management (ISM) reported its manufacturing index fell back into contraction in March as manufacturers began to feel the brunt of the coronavirus. ISM reported its manufacturing index slipped 1.0 point last month to 49.1. Readings below 50 indicate more companies are contracting rather than expanding. Economists had expected a much lower reading of 44. In the report, new orders plummeted 7.6 points to 42.2—the lowest level since March 2009. Employment was also cut at its fastest pace since May 2009. Of note, the gauge that tracks the speed of deliveries indicated a slowdown. Normally this gauge reflects stronger demand, however in this case it is primarily due to supply chain disruptions. The ISM index is compiled from a survey of executives who order raw materials and other supplies for their companies. The gauge tends to rise or fall in tandem with the health of the economy.