In the markets:
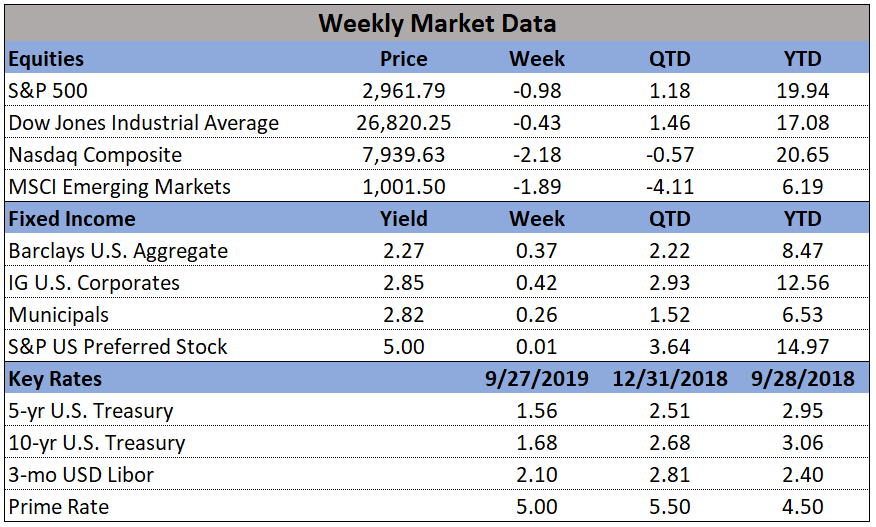
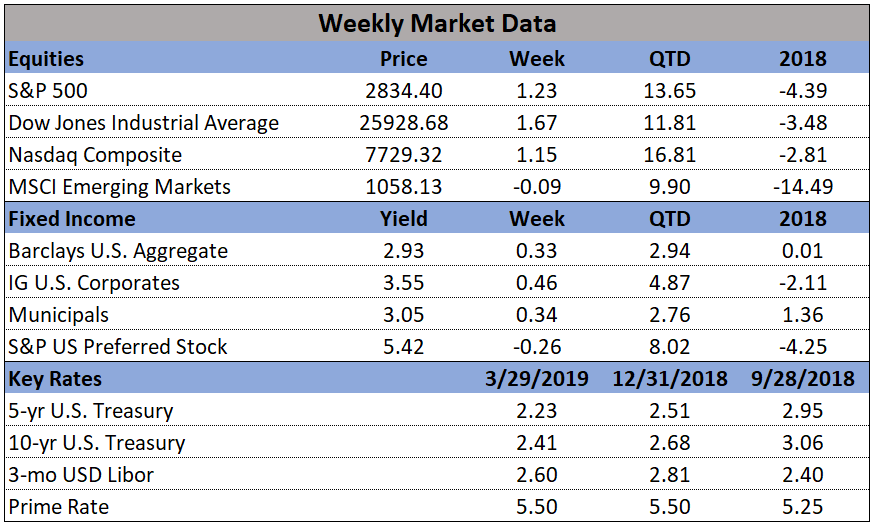
U.S. Markets: The major U.S. indexes managed to retrace most of the previous week’s losses and made the first quarter of 2019 the best quarter for stocks in a decade. The Dow Jones Industrial Average rose 426 points, finishing the week at 25,928 and posting a gain of 1.7%. The technology-heavy NASDAQ Composite added 87 points, or 1.1%, closing at 7,729. By market cap, the large cap S&P 500 rose 1.2%, while the mid cap S&P 400 gained 2.2% and the small cap Russell 2000 added 2.3%.
International Markets: Canada’s TSX rose a meager 0.1%, while the United Kingdom’s FTSE added 1.0%. Major markets in Europe rebounded from last week’s selling with France’s CAC 40 rising 1.5%, Germany’s DAX gaining 1.4%, and Italy’s Milan FTSE adding 1.0%. In Asia, China’s Shanghai Composite retreated -0.4% and Japan’s Nikkei fell -2.0%. As grouped by Morgan Stanley Capital International, developed markets rose 0.9%, while emerging markets added 1.2%.
Commodities: Gold retreated -1.1% to $1298.50 an ounce and Silver declined -1.9% to $15.11. Crude oil rose for a fourth consecutive week, up 1.9% closing at $60.14 per barrel. Copper retraced all of last week’s decline by rising 3.3%.
March Summary: For the month of March, the Dow rose a scant 0.05%, while the NASDAQ gained 2.6%, and the S&P 500 rose 1.8%. The mid cap S&P 400 and small cap Russell 2000 went the other way, declining -0.7% and -2.3%, respectively. In international markets, Canada’s TSX gained 0.6% and the UK’s FTSE rose 2.9%. France’s CAC 40 gained 2.1%, Germany’s DAX added 0.1%, and Italy’s Milan FTSE gained 3%. China’s Shanghai Composite surged 5.1% but Japan’s Nikkei fell -0.8%. Developed markets as a group gained 0.9% and emerging markets as a group added 1.1%. Precious metals retreated in March in the face of strength in the financial markets. Gold pulled back -1.3% and Silver declined -3.3%. The industrial metal copper declined -0.4%. West Texas Intermediate crude oil rose smartly by 5.1%.
First Quarter Summary: In the first quarter of 2019, the Dow gained 11%, the NASDAQ rose 17%, the S&P 500 gained 13%, and the S&P 400 and Russell 2000 each finished up 14%, capping off the best quarter in nearly a decade. International markets did nearly as well. Canada’s TSX rebounded 12.4% and the UK’s FTSE gained 8.2%. France’s CAC 40 rose 13.1%, Germany’s DAX added 9.2%, and Italy’s Milan FTSE gained 16.2%. China’s Shanghai Composite got the blue ribbon among equity markets by rising 24% and Japan’s Nikkei gained 6%. Developed markets as a group added 10.3% while emerging markets as a group rose 9.9%. Gold rose a modest 1.3% and Silver actually declined -2.8%. Copper finished ahead by 11.6% for the quarter and Oil was the big winner among the major commodities, surging 32.4%
U.S. Economic News: The number of Americans applying for new unemployment benefits fell by 5,000 last week to 211,000 matching the lowest level of the year. The reading was well below the consensus forecast of 220,000. The monthly average of new claims, smoothed to iron out the weekly volatility, fell by 3,250 to 217,250. The reading remains well below the 300,000 threshold analysts use to indicate a “healthy” labor market. Continuing claims, which counts the number of people already receiving benefits, rose by 13,000 to 1.76 million.
After a strong start to the year, the number of homes in which a contract has been signed but not yet closed fell 1% in February, the National Association of Realtors (NAR) reported. In addition, contract signings have declined on a year-over-year basis for 14 consecutive months. By region, there was a 7.2% drop in the Midwest, but the other regions saw smaller moves, including gains in the West and the South and a modest 0.8% drop in the Northeast. Lawrence Yun, the chief economist of the NAR, said the decline wasn’t a surprise after a strong January increase of nearly 5%. For the year, the NAR is forecasting existing home sales to fall 0.7% to 5.3 million and the median existing home price to climb just 2.7%.
The number of new homes under construction plunged 8.7% in March to an annual pace of 1.16 million, the Commerce Department reported. The reading was far below economists’ forecasts of just a 1.6% pullback. The decline was led by a 17% drop in single-family starts, the biggest drop since early 2015. Work on new construction plunged 30% in the Northeast, 19% in the West and 7% in the South. The Midwest was the lone bright spot, with starts rising 27%. Building permits also fell, down 1.6% to a 1.296-million-unit annual rate, but at least that reading exceeded forecasts of a 2.6% drop. From the same time last year, both housing starts and permits continued to decline, down 9.9% and 2.0%, respectively, year-over-year.
A measure of the broader U.S. economy showed slower growth for the beginning of 2019. The Chicago Fed’s National Activity Index (CFNAI) fell -0.04 points in February to -0.29 and has been in negative territory for four out of the last five months. In addition, the index is over 1 point below its level from the same time last year, making this drop the biggest year-over-year drop since February of 2015. The decline was led by employment-related indicators - payrolls growth, in particular, slowed markedly last month. The three-month average of the CFNAI dropped to -0.18, the lowest reading since October of 2016. The CFNAI is a weighted average of 85 economic indicators, designed so that zero represents trend growth. Of the 85 indicators, 38 made positive contributions in February, while 47 made negative contributions.
Confidence among the nation’s consumers fell in March, reflecting greater worries about the health of the U.S. economy. The Conference Board reported its Consumer Confidence Index dropped to 124.1 from 131.4 in February. Economists had expected a reading of 133. In the details, the “present situation index” fell 12 points to 160.6, its biggest one-month decline since the middle of the financial crisis in 2008. In addition, the measure of how Americans think the economy will be six months from now declined four points to 99.8. Confidence declined across all demographic and most income groups. Even so, the current level of confidence is nonetheless consistent with above-trend economic growth, and consumer spending remains the driving force of this expansion.
New Gross Domestic Product (GDP) figures show the economy grew a slower 2.2% in the fourth quarter, down from the 2.6% originally reported. The main contributors to the downgrade were downward revisions to consumer spending, government spending, and capital expenditures. In addition, adjusted pretax corporate profits fell slightly in the fourth quarter, marking the first decline in almost two years. Even after the downward revision, however, GDP for all of 2018 was left at 2.9%. That matched 2015 for the best performance since the Great Recession a decade ago. While some analysts are forecasting an impending recession, Sal Guatieri, senior economist of BMO Capital Markets stated, “The impact of tax cuts is fading, but the underlying trend in activity still points more to a moderation in growth rather than a recession.”