In the markets:
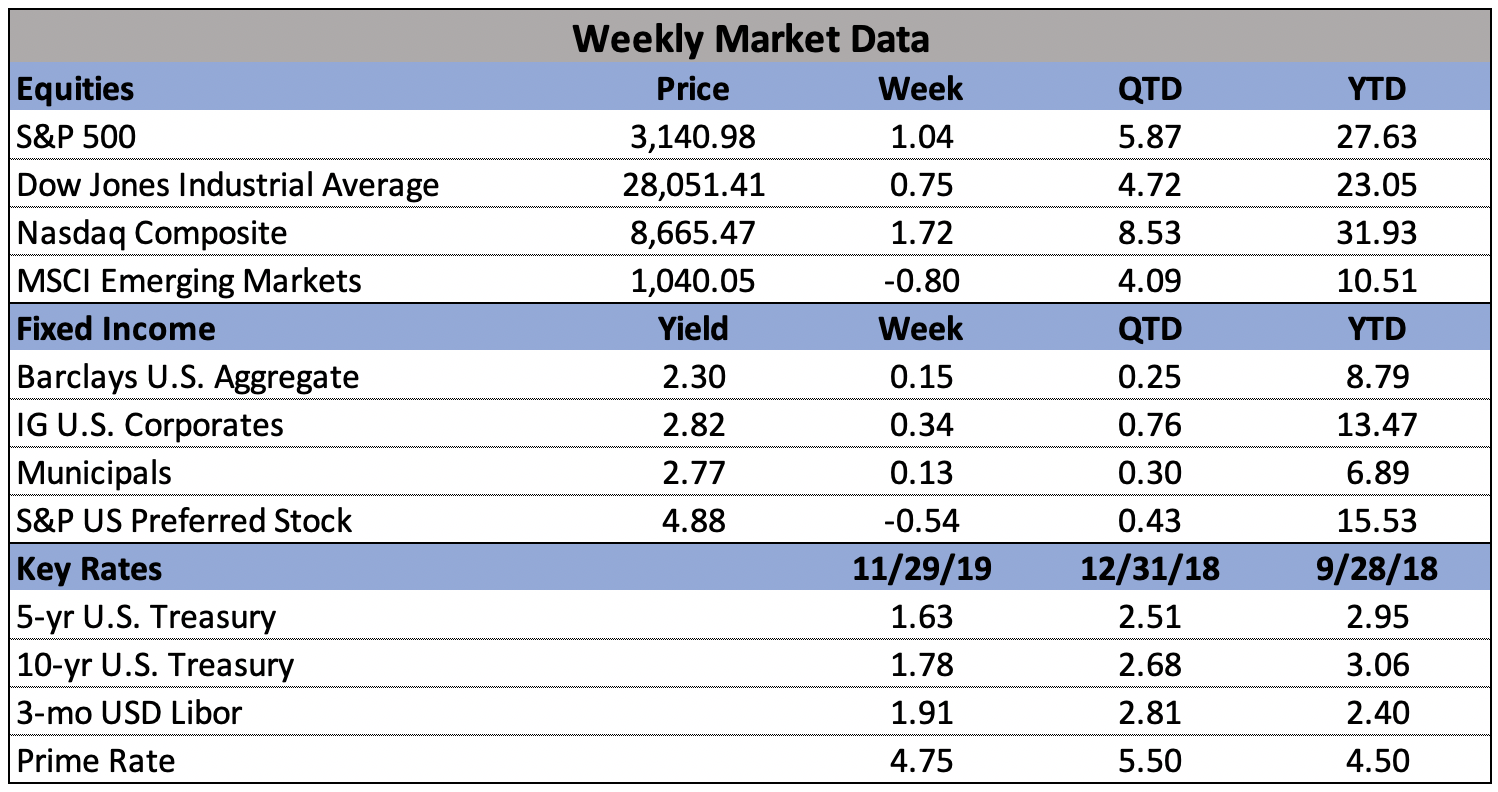
U.S. Markets: Growing optimism about a “phase one” trade deal between the U.S. and China helped stocks close higher for the holiday-shortened week. The large cap Dow Jones Industrial Average and S&P 500 index each hit record highs, as did the technology-heavy NASDAQ Composite. The Dow Jones Industrial Average added 175 points to close at 28,051, a gain of 0.6%. The NASDAQ added 145 points, to finish the week up 1.7%. By market cap, the large cap S&P 500 rose 1.0%, while the mid cap S&P 400 index and small cap Russell 2000 added 1.2% and 2.2%, respectively.
International Markets: Canada’s TSX retraced all of last week’s decline by rising 0.5%, while across the Atlantic the United Kingdom’s FTSE added 0.3%. On Europe’s mainland, France’s CAC 40 rose 0.2%, Germany’s DAX added 0.6%, and Italy’s Milan FTSE ended the week flat. In Asia, China’s Shanghai Composite fell for a third consecutive week down -0.5%. Japan’s Nikkei finished the week up 0.8%. As grouped by Morgan Stanley Capital International, developed markets rose 0.3%, while emerging markets declined -0.8%.
Commodities: Precious metals finished the week to the upside, with both Gold and Silver gaining 0.6%. Gold finished the week at $1472.70, while Silver closed at $17.11. Oil ended the week down -4.5% to $55.17 per barrel of West Texas Intermediate crude. Copper, viewed by some analysts as a barometer of world economic health due to its wide variety of industrial uses, gained 0.5% for the week.
November Summary: In the U.S., the NASDAQ led to the upside adding 4.5% for the month, followed by the small cap Russell 2000 which added 4.0% and the Dow which gained 3.7%. The benchmark S&P 500 index gained 3.4% while the mid cap S&P 400 added 2.8%. Almost all major international indexes also finished to the upside in November. Canada’s TSX added 3.4% while the UK’s FTSE added 1.4%. France’s CAC 40 added 3.1%, Germany’s DAX gained 2.9%, and Italy’s Milan FTSE added 2.5%. China’s Shanghai Composite was the only major index that finished in the red, down -2.0%, while Japan’s Nikkei rose 1.6%. Emerging markets finished the month down -0.1%, while developed markets gained 1.1% during November. Both gold and silver retreated in November, losing -2.8% and -5.3%, respectively, while oil added 1.8% and copper finished the month up 0.8%.
U.S. Economic News: The number of Americans claiming first-time unemployment benefits fell back to near post-recession lows. The Labor Department reported initial jobless claims declined by 15,000 to 213,000 last week. Economists had forecast new claims would total 220,000. Jobless claims are often volatile during the holiday season so analysts frequently turn to the monthly average of new claims to gauge trends. The 4-week average of new claims fell by 1,900 to 219,750. Continuing claims, which counts the number of people already collecting benefits, declined by 57,000 to 1.64 million. That number is near its lowest level since the early 1970’s.
The Commerce Department reported that sales of newly-constructed homes decreased 0.7% on a monthly basis in October to a seasonally-adjusted annual rate of 733,000. Economists had forecast sales would number 705,000. Notably, this was the first month since 2007 that the annual pace of single-family home sales remained above 700,000 for three consecutive months. The median sales price for a new home was $316,700. The government estimated there was a 5.3 month supply of new homes available for sale, down from 5.5 months in September. Economists generally consider a 6-month supply a “balanced” housing market. Regionally, home sales increased in the West and Midwest, but fell in the Northeast and South.
Home prices continued to rise in September according to the latest home price data. Research firm S&P reported its Case-Shiller metropolitan area home price index rose 0.4% month-over-month, 2.1% higher than the same time last year. Nationwide, home prices were also up 0.4% in September, and up 3.2% over the past year. Phoenix saw the biggest increase in home prices with a 6% increase from last year followed closely by Charlotte, North Carolina (up 4.6%) and Tampa, Florida (up 4.5%). Lynn Fisher, the Federal Housing Finance Agency’s senior advisor for economics noted that homes in costlier states like California and New York are now appreciating at rates that are lower than the national average. “At the same time, out migration from high-cost areas is placing upward pressure on home prices in states like Idaho, Utah, Arizona, New Mexico, Vermont and Maine, which all now rank in the top 10 states by appreciation rate,” she wrote.
Confidence among the nation’s consumers fell for the fourth consecutive month, as Americans expressed more worries about the U.S. labor market. The Conference Board reported its consumer confidence index slipped 0.6 point to 125.5. Economists had expected a reading of 128.2. Just over a year ago, the consumer confidence index hit an 18-year high, but it has steadily fallen in the wake of lingering trade tensions with China. In the details, the way Americans feel about the economy at the moment dipped slightly, however they expect it to improve in the months ahead. The so-called present situation index dipped to 166.9 from 173. Yet the gauge that looks at expectations six months from now rose to 97.9 from 94.5. “Overall, confidence levels are still high and should support solid spending during this holiday season,” said Lynn Franco, director of economic indicators at the privately-run Conference Board.
Despite the lack of confidence reported above by the Conference Board, consumers continued to open their wallets. Consumer spending rose for the eighth consecutive month in October, a good sign for the holiday shopping season. The Commerce Department reported consumer spending increased 0.3% last month, exceeding economists’ forecasts of a 0.2% increase. Also in the report, a key measure of inflation increased by just a few ticks. The Personal Consumption Expenditures Index (PCEI), said to be the Federal Reserve’s “preferred” inflation gauge, rose 0.2%. Inflation has been tame over the past year and showed little sign of becoming a problem for the economy. Over the past year, the PCEI showed prices rising at just 1.3% - well below the central bank’s 2% target.
Orders for long-lasting goods expected to last at least three years, so-called “durable goods”, rose in October, but most of the increase was due to military hardware. The Commerce Department reported orders for durable goods rose 0.6% last month, with most of the gain coming from defense-related purchases such as jet fighters and ships. Stripping out military hardware, orders for consumer products barely rose—up just 0.1%. Economists had forecast a drop of -1.1%. Core orders, which strips out defense spending and commercial aircraft, surged 1.2%--its biggest gain since January. Avery Shenfeld, senior economist at CIBC World Markets stated, “U.S. durable orders showed a bit more durability than we thought in the face of an auto strike and global growth headwinds.”
The U.S. economy grew at a 2.1% annual pace in the third quarter, a few ticks higher than previously estimated by the Bureau of Economic Analysis (BEA). GDP was originally estimated to have grown 1.9%. The main driver of growth, consumer spending, remained at 2.9%, however there were upward revisions in inventories and investment in structures. Exports rose a bit faster at 0.9% while imports advanced 0.8% instead of 0.4% as initially reported. Most other figures in the BEA report were little changed, including inflation.